Posts in Mercati oggi
Ben arrivato 2018 (parte 5): il rischio esiste ancora?
2018_new_018.png

Nel 2017 abbiamo assistito a quanto di più impensabile: mercati finanziari che NON reagiscono, anche a fronte di notizie di grande importanza sul fronte geopolitico.

La situazione potrebbe ripetersi, nel 2018? Quello che abbiamo letto nelle ultime settimane, ed anche sondaggi come quello che segue, ci raccontano di operatori che seguono con grande timore a vicende come quella della Corea del Nord, che proprio oggi è tornata sulle prime pagine dei quotidiani.

2018_new_019.png

A rischio di apparire cinici ai nostri lettori, noi suggeriamo di fronti a fatti come questi di agire sempre sulla base dei dati, ovvero delle stime del potenziale impatto economico. Anche nei casi in cui l'impatto economico viene, nell'immediato, ignorato dai mercati: perché si tratta solo di una molla che si carica, di una ... "bomba" ad effetto ritardato.

2018_new_001.png
Mercati oggiValter Buffo
Ben arrivato 2018 (parte 4): la crescita, finalmente?

La più grande e potente banca di investimento internazionale, Goldman Sachs, ha rivisto proprio a fine anno 2017, dopo che il Congresso USA ha approvato i tagli alle tasse, le proprie stime di crescita per gli Stati Uniti nel 2018. Eccole riassunte qui sotto.

In its latest note, analysts at Goldman Sachs (GS) assess the impact of the US tax reform law on the US GDP going forward.

Key Quotes:

GS estimate an addition from the tax bill of 0.3% in 2018 and +0.3% in 2019.

GS increase their "GDP forecasts for 2018 and 2019 by 0.3pp and 0.2pp" on "a Q4/Q4 basis (to 2.6% and 1.7%)".

They cite an "incremental easing in financial conditions and continued the strong economic momentum to end the year".

Year-end 2018 unemployment rate forecast lowered by two tenths to 3.5%, "mainly reflecting a modestly higher expected pace of job growth".

Expect the unemployment rate to bottom in this cycle at 3.3%, at the end of 2019.

With more fiscal stimulus comes larger deficits.

“We are increasing our deficit projection”.

“We expect the deficit to rise to 3.7% of GDP in FY2018 and to 5% of GDP in 2019”.

Quindi: 2,6% nel 2018, e 1,9% nel 2019. Due dati sui quali riflettere con attenzione: da molti mesi, infatti, vi fanno leggere articoli che anticipano un miglioramento della crescita economica, negli Stati Uniti e nel Mondo intero. Attenzione.

Vi suggeriamo, poi, di mettere a confronto queste stime, ed il modo nel quale vengono motivate, con quello che scriveva la stessa Goldman Sachs solo 12 mesi prima.

Ecco documentata una ragione per la quale a voi, investitori finali, serve di avere a fianco un consulente indipendente.

Mercati oggiValter Buffo
Ben arrivato 2018 (parte 3): si torna alle cose serie?
2018_new_017.png

Ci sono pochi dubbi: nel 2017, ciò che vedete nell'immagine sopra è stato un fattore. Per tutti gli investitori.

Anche durante la pausa di Fine Anno, il Presidente degli Stato Uniti ha voluto fare conoscere al Mondo la sua "chiave politica di lettura della Borsa".

Come investitori, e a prescindere dalle simpatie oppure antipatie politiche, possiamo solo augurarci che la politica stia il più lontano possibile dai mercati e dalla Borsa. Quando ci mette le mani, fa solo danni, spesso gravissimi.

Nel 2017 non è stato così: le influenze improprie sui mercati sono state forti, e anche l'immagine in alto lo documenta.

La Borsa utilizzata come clava politica, contro l'opposizione (in questo caso, i Democratici USA), a noi ricorda certi film che ricostruiscono i drammi politici del Sud America negli anni Settanta.

Investire a nostro giudizio significa anche capire dinamiche come queste: capire se ci sono manipolazioni e storture, difendere i Clienti da rischi del tutti impropri e non controllabili, e poi riportare ai Clienti i giusti guadagni, non appena sui mercati si tornerà a parlare ... di cose serie. Come sempre è successo, e sempre succederà.

La nostra sensazione (e non solo nostra) e che proprio di questo specifico tema si tornerà a parlare a breve, anzi a brevissimo.

Mercati oggiValter Buffo
Ben arrivato 2018 (parte 1): vincitori e perdenti

Guardiamoci indietro per un'ultima volta: il 2017 ci lascia un'eredità che ci ha visti in difficoltà, per ciò che riguarda i risultati, ma che allo stesso tempo ci crea opportunità molto grandi per il 2018, molto più grandi rispetto al recente passato.

Non nascondiamoci, però: c'è chi, nel 2018, ha fatto meglio. Cavalcando l'onda, seguendo il trend, scommettendo sull'entusiasmo, approfittando del "momento di mercato".

Ci interessa? Ci tocca da vicino? Ci preoccupa? Ci fa sentire ... sconfitti?

Per dare una risposta che sia oggettiva, e non emotiva, diventa importante quantificare: chiedersi "quali occasioni abbiamo perso" nel 2017.

Il sito Morningstar, che voi stessi potete consultare in ogni momento, ci aiuta proprio in questo senso, con la tabella che segue.

Morningstar_2018_001.png
Morningstar_2018_002.png

Come abbiamo fatto anche in passato, utilizziamo i dati relativi ai Fondi Comuni in Italia, che potete vedere qui sopra. La terza colonna è quella della performance annuale, mentre la quinta colonna è quella della performance media degli ultimi cinque anni.

Nell'analizzare questi dati, vi chiediamo di ricordare che sono dati che arrivano alla fine di un lungo periodo di rialzi degli indici, di tutti gli indici: sono, quindi, i dati che i Fondi Comuni hanno realizzato in un periodo che, per i Fondi Comini stessi, non poteva essere più favorevole. La "famosa" marea che ha fatto salire tutte le barche.

Marea che, prima o dopo, si ritirerà certamente.

Tutto ciò detto, vi chiediamo di analizzare anche con attenzione i dati della sesta colonna, che è la deviazione standard, ovvero la volatilità (la "instabilità") dei portafogli: vi ricordiamo che questo è il SECONDO OBBIETTIVO ESPLICITO delle nostre gestioni.

Grazie alla nostra scelta di grande prudenza (LONG di cassa, di liquidità) noi nel 2017 abbiamo realizzato una deviazione standard dei portafogli vicina a 5 sul portafoglio RNI che è quello più rappresentato nelle scelte dei Clienti.

Il dato è importantissimo: aiuta l'investitore a NON mischiare ... le mele con le patate.

Tutto ciò detto, vi scriviamo anche quale è la NOSTRA conclusione, una volta esaminati questi dati: Recce'd non si ritiene perdente, anche se nel 2017 abbiamo faticato, e molto. 

Recce'd guarda sia al dato annuale sia a quello degli ultimi cinque anni, che ci vede ancora in vantaggio.

Recce'd conclude che molto presto torneremo in cima anche alle classifiche annuali (dove stiamo quasi sempre), e questo mantenendo però sempre il profilo di rischio sotto uno stretto controllo (in termini di deviazione standard).

Mercati oggiValter Buffo
Come gestire nel 2018 (parte 5): sperare NON è una strategia
2018_new_016.png

Il titolo è una notissima (ci hanno intitolato anche dei libri) frase fatta degli anglosassoni: "hope is not a strategy".

Sta di fatto che, nel 2018, le masse degli investitori hanno scelto di agire proprio in quel modo: "sperando" che da oggi in poi le cose vadano alla grande.

Certo, sono stati spinti, pressati, indottrinati. E' vero, va riconosciuto. E tuttavia ... così tanta "ingenuità" a noi sembra un caso da "psicologia delle masse".

Da anni, Recce'd sta qui a spiegare ai Clienti che "hope is not a strategy": anche solo per un istante, allontanare gli occhi dai dati di fatto, e farsi coinvolgere nella psicologia di massa, può essere un errore fatale.L'errore di una vita intera.

Se non ne siete convinti, rileggetevi questo brano: un brano che riportiamo in inglese per non modificare nulla. Non ci sono opinioni: solo un elenco di eventi storici e di dati di fatto, molto recenti, dai quali però (almeno fino ad oggi) le varie BCE, Fed, Goldman Sachs, Morgan Stanley, e la massa degli investitori sembrano non avere imparato nulla.

Recce'd vi invita non solo a riflettere: noi vi invitiamo, a investire, insieme a noi, in modo conseguente.

2018_new_010.png

During the 40 months after Alan Greenspan's infamous "irrational exuberance" speech in December 1996, the NASDAQ 100 index rose from 830 to 4585 or by 450%. But the perma-bulls said not to worry: This time is different----it's a new age of technology miracles that will change the laws of finance forever.

It wasn't. The market cracked in April 2000 and did not stop plunging until the NASDAQ 100 index hit 815 in early October 2002. During those heart-stopping 30 months of free-fall, all the gains of the tech boom were wiped out in an 84% collapse of the index. Overall, the market value of household equities sank from $10.0 trillion to $4.8 trillion----a wipeout from which millions of baby boom households have never recovered.

Likewise, the second Greenspan housing and credit boom generated a similar round trip of bubble inflation and collapse. During the 57 months after the October 2002 bottom, the Russell 2000 (RUT) climbed the proverbial wall-of-worry----rising from 340 to 850 or by 2.5X.

And this time was also held to be different because, purportedly, the art of central banking had been perfected in what Bernanke was pleased to call the "Great Moderation". Taking the cue, Wall Street dubbed it the Goldilocks Economy----meaning a macroeconomic environment so stable, productive and balanced that it would never again be vulnerable to a recessionary contraction and the resulting plunge in corporate profits and stock prices.

Wrong again!

During the 20 months from the July 2007 peak to the March 2009 bottom, the RUT gave it all back. And we mean every bit of it----as the index bottomed 60% lower at 340. This time the value of household equities plunged by $6 trillion, and still millions more baby-boomers were carried out of the casino on their shields never to return.

Now has come the greatest central bank fueled bubble ever. During nine years of radical monetary experimentation under ZIRP and QE, the value of equities owned by US households exploded still higher----this time by $12.5 trillion. Yet this eruption, like the prior two, was not a reflection of main street growth and prosperity, but Wall Street speculation fostered by massive central bank liquidity and price-keeping operations.

Nevertheless, this time is, actually, very different. This time the central banks are out of dry powder and belatedly recognize that they have stranded themselves on or near the zero bound where they are saddled with massively bloated balance sheets.

(...) 

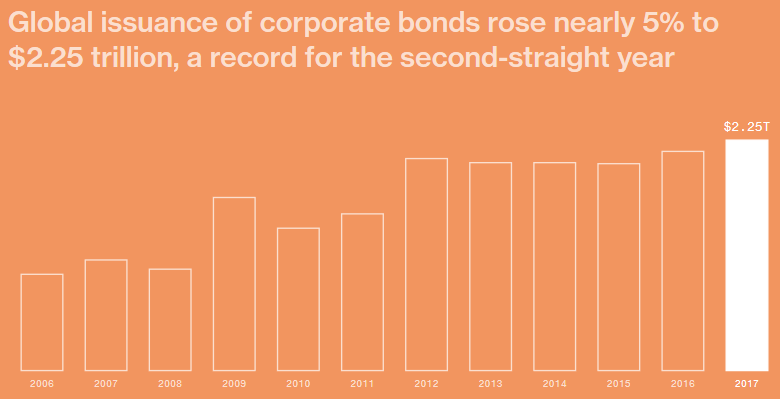
In short, this time is truly different because the impending, spectacular late-cycle collision of US fiscal and monetary policies is sure to rock the $100 billion global bond market with severe, cascading ripples of downward pricing adjustments (i.e. higher yields and wider spreads). Yet the entire price structure of the equity market incorporates the previous era of drastically repressed yields.

In our judgment, a large share of the $15 trillion of US stock buybacks and M&A deals over the last decade would not have happened---save for the ultra-low after-tax cost of debt. For instance, mega-M&A deals by investment grade companies always look accretive to earnings because they have been 85% cash/debt financed at a weighted average after-tax cost of under 2.0%.

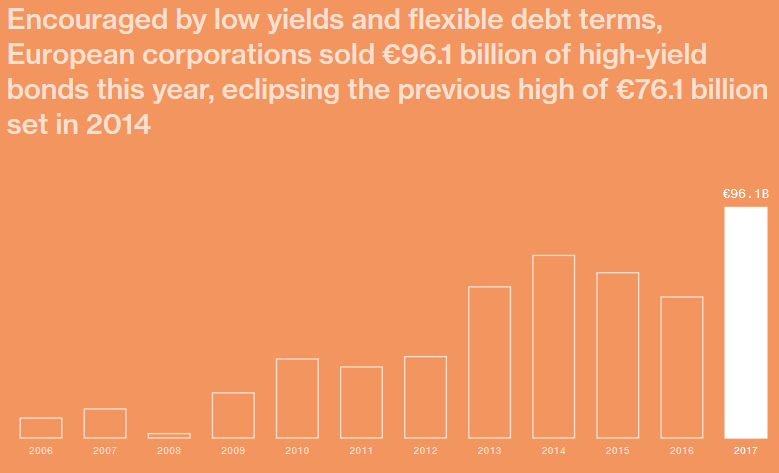
Likewise, the scramble for yield has funded a massive revival of the junk loan and bond markets---with combined outstandings now pushing $4 trillion or more than double the 2007 level. On the margin, virtually every dollar of that $2 trillion gain went into the liquidation of corporate equities via LBO's and leveraged recaps.

In a word, a huge chunk of the over-valuation in today's stock markets reflects the cheap debt fueled financial engineering "bid" for stocks that will be literally monkey-hammered by the central bank pivot to QT---compounded by the fiscal insanity of the Trump-GOP debt binge.

In that context, the insouciant complacency in today's casino is all the more remarkable---and dangerous. The VIX index average during 2017 came in at 11.1. That is the lowest reading ever - by more than one and a half points - since the VIX inception in 1986. By way of comparison, the daily average for all years since then was over 20.

Likewise, the maximum level reached by the VIX in 2017 was 17.3. That's the lowest maximum level attained in any year since inception----and 60% lower than average.

2018_new_009.png
Mercati oggiValter Buffo