

Quello che vi presentiamo in questo Post è una anteprima. In questo Post, potete vedere per la prima volta il formato di una nostra nuova serie di pubblicazioni. La nuova serie (Longform’d) fa parte di una serie di nuove iniziative di comunicazione che Recce’d lancerà a partire dal mese di settembre.
Manterremo il nostro solito stile, asciutto, to the point e legato all’attualità dei mercati finanziari: ma andremo più a fondo. Non troverete alcuna indicazione operativa: quelle sono ovviamente riservate ai nostri Clienti. Si tratta di materiale che non potete trovare in alcuna altra sede. Non leggendo i quotidiani, non seguendo le TV specializzate, e soprattutto non nel materiale pubblicitario delle Reti che vendono Fondi Comuni, come (ad esempio) Azimut, Mediolanum, Fideuram, FINECO e Banca Generali.
Per alcune settimane, questi materiali verranno messi in modo gratuito a disposizione del pubblico. Poi, sarà introdotta una formula a pagamento: sia perché il lavoro si paga, sia per scoraggiare i perditempo, sia per non fare un favore ai venditori di Fonbdi Comuni che ogni giorno sono alla disperata ricerca di un nuovo argomento per “piazzare la merce”.

Nella settimana dei dati per l’inflazione (Stati Uniti e Germania in testa) Recce’d ha scelto di approfondire proprio questo argomento, che in apparenza oggi si colloca ai margini del dibattito tra operatori, investitori, politici e Autorità monetarie, ma che potrebbe invece assumere un ruolo centrale da qui a fine 2020.
Un secondo spunto di attualità, che ci suggerisce di approfondire questo tema, lo trovate elencato nell’immagine che segue: tutti impegnati a commentare, ed esaltare, i nuovi massimi del Nasdaq e dell’oro, i mezzi di informazione hanno trascurato un altro record registrato sui mercati finanziari la settimana scorsa.

Sono molti quelli che, leggendo di tutti questi “record”, anziché farsi delle domande dicono ai loro Clienti che “va tutto bene”, in particolare tra i venditori di Fondi Comuni (wealth managers, private bankers, robo-advisors, e compagnia bella). La grande parte di loro non ha colpa: semplicemente, non si rende conto non sa di che cosa parla.

Eppure, ci sono clamorose evidenze che dicono, a tutti investitori, che non va tutto bene. La situazione sui mercati finanziari è fragilissima, e la sorpresa è dietro l’angolo.
Vediamo nel concreto. Non è certo la prima volta in cui noi di Recce’d mettiamo in evidenza la distanza abissale che si manifesta attraverso i prezzi di mercato, con i prezzi di Borsa che scontano una ripresa economica a V e la totale assenza di incertezza, mentre al contrario come leggete anche sopra nell’immagine i prezzi delle obbligazioni ci raccontano di un futuro fatto di depressione economica e di inflazione.
Lo abbiamo già visto in passato, ed anche nel recente passato: ed abbiamo chiarito ai nostri lettori due cose:
la prima è che questa schizofrenia dei mercati è il prodotto diretto delle politiche distorsive, ed incontrollate, delle Banche Centrali, politiche presentate al pubblico ormai da 11 anni come politiche finalizzate al “rilancio dell’economia” e che hanno per 11 anni lasciato le economie reali nelle medesime difficoltà che si riscontravano subito dopo la Grande Crisi Finanziaria 2007-2009
la seconda cosa che va precisata, nell’interesse di ogni lettore che sia anche investitore, è che in questa palese schizofrenia risiede quella fragilità profonda del sistema (sia finanziario, sia economico) che si è manifestata con chiarezza tra febbraio e marzo 2020, e che tornerà a manifestarsi, probabilmente entro fine 2020
Come abbiamo scritto poco sopra, nel settore del risparmio e della consulenza sono in moltissimi in questa estate del 2020 a ricorrere al solito e vecchio argomento del “va tutto bene”, al solo scopo di tranquillizzare i Clienti e mantenerli investiti come sono oggi, investiti attraverso prodotti finanziari molto costosi e poco o per nulla efficienti (come dimostrano chiaramente le performances ottenute ma soprattutto i rischi sopportati nel frattempo dal Cliente investitore, che quattro mesi fa si ritrovava con il capitale ridotto ai livelli del 2015.
In Italia sono molti gli investitori tuttora intrappolati nelle reti delle Reti: quelli che si affidano al private banker, al robo advisor, al wealth manager, e che per questa ragione oggi si sono fatti raccontare che tutto va bene. Il wealth manager, il robo advisor, il personal banker ed il family banker, però, una spiegazione per la schizofrenia che abbiamo appena documentato non ce l’ha, non la può offrire, non è in grado di offrirla. Lui, quel “consulente addetto alla vendita” non ha la minima idea di chi racconti la storia nel modo giusto: il futuro che ci attende è quello descritto dal mercato di Borsa, oppure è quello descritto dal mercato delle obbligazioni?

Per rispondere a questa semplice domanda, non potete fare a meno di approfondire, e non potete fare a meno di comprendere meglio: non potete fare a meno di capire. Vi mente, vi racconta frottole, chi vi racconta che non è necessario capire, che dovete chiudere gli occhi e buttarvi, perché tutto si sistemerà. Sono quelle filastrocche che si raccontano ai bambini prima di addormentarsi.
Proprio per questa ragione, oggi noi di Recce’d regaliamo questo approfondimento: per aiutare chi ci legge a capire, e quindi a scegliere meglio, e quindi ad agire nel loro interesse. Perché non c’è più tempo.

In questo Post, mostreremo al lettore la stretta connessione tra il tema dell’inflazione, dell’oro, del dollaro USA e dei rendimenti delle obbligazioni: la ragione è che delle Borse oppure dell’oro scrivono, e parlano tutti, mentre invece fino ad oggi e per qualche anno delle obbligazioni parlano e scrivono pochissimo. E come sempre accade, sarà invece proprio dalle obbligazioni che arriverà il prossimo e profondo shock per tutti noi investitori.
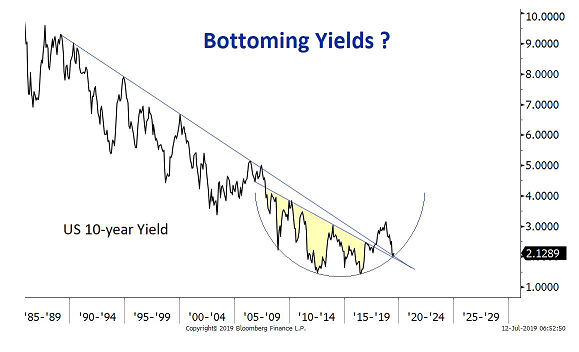
Partiremo dal fatto che oggi un Titolo di Stato a 10 anni rende in Italia lo 1% circa, negli Stati Uniti mezzo punto percentuale, e in Germania un NEGATIVO 0,50%. Al proposito, è utile vedere insieme il grafico qui sopra: grafico che vi racconta che negli Stati Uniti, oggi, il rendimento dei Treasuries a 10 anni è NEGATIVO in termini reali di circa un punto percentuale. Tradotto in termini pratici, questo calcolo ci racconta che l’investitore accetta oggi una remunerazione del proprio investimento inferiore all’attuale tasso di inflazione, ed accetta quindi di ricevere a scadenza, nel caso in cui l’inflazione dovesse rimanere quella che è oggi, un potere di acquisto diminuito del 10% rispetto al valore del suo iniziale investimento.
Gli investitori, ovviamente, non sono impazziti: vengono costretti ad accettare questa remunerazione, penalizzante per l’investitore, da una politica monetaria che obbliga alcune categorie di operatori (le banche commerciali, le compagnie di assicurazione, e i fondi pensione) ad acquistare in ogni condizione di mercato i Titoli di Stato, anche se è consapevole di compiere una operazione di investimento che lo danneggerà.
Sugli investitori individuali, ed al dettaglio, si riflette semplicemente questa situazione: chi investe sui Titoli di Stato lo fa sapendo che perderà i propri soldi, quanto meno in termine di potere di acquisto del denaro investito. E, nel caso della Germania, anche in termini monetari. Riceverà alla scadenza MENO soldi di quelli investiti.
E questa situazione, disgraziata sia per gli investitori individuali sia per gli investitori professionali, adesso sta anche per peggiorare.

Il titolo di Bloomberg che leggete qui sopra annuncia che la Federal Reserve sta per annunciare un “cambiamento di maggiori dimensioni nella propria politica”.
Recce’d sceglie ancora una volta di scrivere di ciò che fa la Federal Reserve perché la BCE, come avete visto, è del tutto inefficace quando si tratta di influenzare i mercati finanziari, e in aggiunta perché la BCE ha sempre fatto, negli ultimi venti anni, niente altro che andare dietro a ciò che fa la Federal Reserve. L’Europa è, dal punto di vista dei mercati finanziari, un vagone-merci che va dove va la locomotiva americana: e la vicenda recentissima del Recovery Fund ha dimostrato, se ce ne fosse stato bisogno, che l’Europa può annunciare tutto ciò che vuole, ma i mercati non reagiscono.
Occupiamoci allora della Federal Reserve, ed impegnamoci ad anticipare questo “maggiore cambiamento di politica”, che andrà direttamente a toccare i valori dei nostri titoli in portafoglio, così come la quota dei Fondi Comuni, degli ETF, dei certificati.
Iniziamo leggendo che cosa ha detto la settimana scorsa la stessa Federal Reserve.

Nel testo che leggete sopra, Kaplan ci anticipa due cose molto precise:
la Federal Reserve spingerà l’inflazione sopra il livello-obbiettivo del 2%, senza reagire
la Federal Reserve adotterà però una politica che mette un tetto ai rendimenti obbligazionari
Le parole di Kaplan anticipano, a tutti voi lettori che siete investiti in Fondi Comuni obbligazionari, oppure direttamente in obbligazioni, che il valore dei vostri investimenti verrà distrutto attraverso un aumento dei prezzi delle merci (l’inflazione) mentre la banca centrale non permetterà ai tassi di mercati di adeguarsi.
Tornando al grafico che abbiamo visto più sopra: quello stato di cose (i rendimenti NEGATIVI in termini reali) non è frutto del caso, ma il frutto di una politica deliberata, che si vuole ulteriormente accentuare. Lo scopo di detta politica è uno solo: rendere più poveri voi, che siete investiti in obbligazioni direttamente, oppure attraverso i Fondi Comuni di Investimento.
Leggiamo altre dichiarazioni dell’ultima settimana.

Le parole di Bullard qui sopra non lasciano spazio ad alcuna interpretazione: “Bring it on”. Per voi, oggi investiti in obbligazioni, una scelta politica di questo tipo implica solo due alternative:
perdere soldi subito, perché da subito il mercato fa salire i rendimenti di mercato (per ogni obbligazione, un aumento del rendimento implica una perdita in termini di prezzo); oppure
perdere soldi a scadenza, perché la Banca Centrale impedisce ai rendimenti di mercato di salire.
Perderete soldi nell’uno e nell’altro caso: ed è quindi opportuno per voi aprire gli occhi oggi, e capire oggi ciò che dice l’immagine sotto: per noi e voi, investitori sui mercati finanziari, oggi la Federal Reserve è il nemico. La BCE è il nemico. La Banca del Giappone è il nemico. La vostra stessa stabilità finanziaria, il vostro benessere finanziario, è a rischio.
E’ necessario operare di conseguenza sui propri portafogli.

Approfondiremo ulteriormente questo argomento, proponendovi in lettura l’articolo di Bloomberg di cui avete già letto il titolo, e che annuncia la “grande svolta nella politica della Banca Centrale”.
For the Federal Reserve, this time really is different. Having learned a hard lesson in the last recovery — don’t tighten monetary policy too early — the central bank is leaning in the opposite direction. In practice, that means the Fed will not just emphasize actual inflation over forecasted inflation, but will also attempt to push the inflate rate above its 2% target. It’s a whole new ballgame.
The Fed’s traditional Phillips curve approach to forecasting inflation, which relies on the theory that inflation accelerates as unemployment falls, was widely criticized during the most recent economic recovery. Inflation remained quiescent in the wake of the Great Financial Crisis even as the unemployment rate fell to 3.5%, well below the 2012 high estimate of the natural rate, or 5.6%. The Fed’s commitment to Phillips curve-based inflation forecasts induced it to raise interest rates too early in the cycle and continue to boost rates into late 2018 even as faltering markets signaled the hikes had gone too far. The Fed was eventually forced to lower rates 75 basis points in 2019 to put a floor under the economy. Inflation remained stubbornly below the Fed’s 2% target throughout that period.
Faced now with the prospect of another prolonged period of low inflation, Fed officials are signaling they will place less emphasis on Phillips curve estimates when setting policy. Fed Governor Lael Brainard said this week that “with inflation exhibiting low sensitivity to labor market tightness, policy should not preemptively withdraw support based on a historically steeper Phillips curve that is not currently in evidence.”
No longer are estimates of longer-run unemployment taken as almost certainly indicating the economy is at full employment. Instead, Brainard said the Fed should focus on achieving “employment outcomes with the kind of breadth and depth that were only achieved late in the previous recovery.” The Fed is going to try to run the economy hot to push down unemployment.
By de-emphasizing the Philips curve, the Fed loses its primary inflation forecasting tool. Instead of an inflation forecast, the Fed will rely on actual inflation outcomes to determine the appropriate time to change policy. Brainard pointed out that “research suggests that refraining from liftoff until inflation reaches 2% could lead to some modest temporary overshooting, which would help offset the previous underperformance.”
Think about what she is saying. Traditionally, the Fed attempts to reach the inflation target from below, effectively using the unemployment rate to forecast inflation and then moderating growth such that projected inflation doesn’t exceed its target. Brainard is saying the Fed should not tighten policy until actual inflation reaches 2%. Policy lags — the time between the Fed’s actions and the resulting economic outcomes — mean inflation will subsequently rise above 2%. The Fed would thus overshoot the inflation target and then return to the target from above.
Federal Reserve Bank of Philadelphia President Patrick Harker goes even further in a Wall Street Journal interview, saying “I don’t see any need to act any time soon until we see substantial movement in inflation to our 2% target and ideally overshooting a bit.” Expect to see more Fed speakers also saying they want inflation at or above 2% before they tighten policy. Also expect to see something along these lines codified at in a policy statement.
This shift also has implications for the Fed’s ongoing review of policy, strategy, and communications. When Brainard talks about offsetting “previous underperformance,” she is giving a green light to a “make-up” strategy in which the Fed compensates for a period of below-target inflation with a period of above-target inflation. The Fed’s current policy does not allow for such a strategy. The broad willingness to accept overshooting implies that the Fed’s policy review will conclude with a shift toward some form of average inflation targeting in which the central bank explicitly sets policy to compensate for errors such that inflation averages 2% over time.
The implication for financial markets is that the Fed expects to hold policy very easy for a very long time. They will reinforce this stance with enhanced-forward guidance and, eventually, yield-curve control. As long as inflation remains below 2%, the Fed will push back on any ideas that they will tighten policy anytime soon. And even inflation above 2% wouldn’t guarantee tighter policy if the Fed concluded the overshoot was transitory. Don’t doubt the Fed’s resolve to keep policy accommodative. They will keep reminding you if you forget.
Nell’articolo qui sopra avete riletto alcune delle cose che il nostro testo del Post vi aveva illustrato: in aggiunta, vi potrà essere utile rivedere i numeri del grafico che segue, un grafico che vi ricorda che è semplice calcolare il rendimento in termini reali dei Titoli di Stato: sarà sufficiente detrarre dal rendimento nominale (quello che leggete sui giornali) il tasso di inflazione che è previsto dal mercato stesso, e che risulta dai prezzi delle obbligazioni indicizzate all’inflazione. Negli Stati Uniti, oggi, sta allo 1,50%.

Tutte le cose che vi abbiamo appena esposte vi dicono che già oggi state perdendo i vostri soldi, se seguite i suggerimenti del robot, del personal banker, del wealth manager: e che ne potreste perdere ancora, e molti di più.
Vi raccontano anche un’altra cosa: vi raccontano di una tensione che sui mercati finanziari sta per raggiungere il livello critico, il livello di rottura.
Sulla base di quali dati Recce’d fa questa affermazione? Vediamolo insieme.
Primo dato, all’apparenza contrario alle nostre conclusioni: la volatilità dei prezzi sul mercato obbligazionari, è ai livelli più bassi di ogni tempo.

Un basso livello di instabilità, limitate oscillazioni dei prezzi sul mercato, dovrebbero in generale segnalare una situazione di calma: ma quando le cose vengono portare a livelli di esasperazione, allora il segnale ci racconta che c’è qualche cosa che non va, che non funziona come dovrebbe.
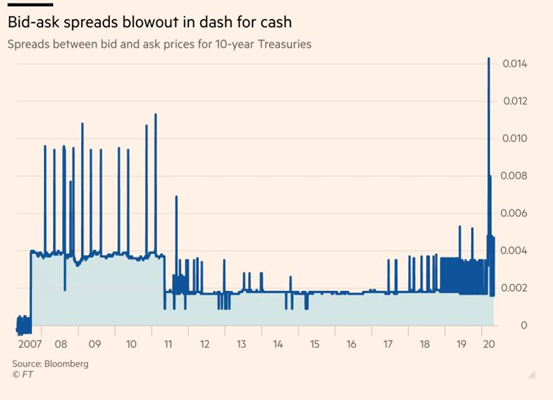
Una conferma in questo senso la trovate nel grafico che segue: sul mercato delle obbligazioni lo spread tra denaro e lettera, ovvero la differenza tra il prezzo a cui si acquista ed il prezzo al quale si è disposti a vendere, è salito nel 2020. E rimane ampio anche oggi, come vedete, dopo il picco di marzo 2020.
Un segnale di scarsa liquidità. Un segnale di scarsa affidabilità dei prezzi. Un segnale di fragilità del mercato delle obbligazioni.
Lo stato del mercato obbligazionario internazionale è descritto in modo efficace dall’articolo che Recce’d ha selezionato per voi, e che è riportato di seguito
The $20 trillion U.S. Treasury market looks like a bastion of calm compared to all the hullabaloo over sharp moves in gold and the dollar.
While U.S. bonds have gained to touch record-low yields for short-term debt, volatility fell to a historic trough on Thursday and held close to it on Friday, according to the ICE BofA MOVE index. By contrast, the greenback has tumbled and gold soared over recent weeks on fears that inflationary forces may be set for a resurgence. Treasuries are so far proving to be immune, thanks to the Federal Reserve’s enormous stimulus and signs that it will keep rates low for years to come.
The Fed is expected to remain accommodative “for a long time -- which suggests rates should be well anchored,” said Pooja Kumra, a rates strategist at Toronto-Dominion Bank, who sees 10-year Treasury yields staying between 0.4% and 0.7%. They are currently around the middle of that range.
It’s a sign that traders believe they know what’s coming from the Fed -- support for bonds. At its meeting last week, Chair Jerome Powell vowed to use all tools to help the recovery and said that extreme caution would still be warranted. Yield-curve control or formal forward guidance are possible options the Fed could use.
In June, Powell said policy makers were “not even thinking about thinking about raising rates.” Investors have been paying heed, with five-year yields steadily making record lows last week.
Benchmark U.S. 10-year bonds slipped Monday, with yields climbing three basis points to 0.56%. Their German equivalent has seen yields hold in a narrow trading range around the European Central Bank’s deposit rate in the past two months.
What Bloomberg Intelligence says:
“The Fed has chopped off the tails of the yield distribution -- on the left side, it has pushed back on negative policy rates, and on the right side it will want to keep rates relatively low. Rates volatility may be used as a funder for equity volatility.”
-- Tanvir Sandhu, Chief Global Derivatives Strategist
The compressed moves compare with a continuing surge in U.S. stocks and a gauge of the dollar touching the lowest level in more than two years Friday. Meanwhile gold’s rally to record highs is like a “freight train” for RBC Capital Markets.
The demand for gold has been boosted by real yields on U.S. 10-year Treasuries, which strip out inflation, falling below minus 1% to a record low. Still, not all are convinced that the growing disconnect between Treasuries, the dollar and gold can last. NatWest Markets recommends betting on a rise in volatility through options.
“To achieve the current goldilocks environment, policy makers have had to unleash a fiscal and monetary arsenal never seen in modern history,” wrote James McCormick, global head of desk strategy at NatWest, in a note. “It is plausible it will all end in the same low volatility/low inflation/low term premia environment of the past 10 years. But it does seem a stretch.”
For Treasuries, things could change once the quieter summer trading period comes to an end in September and central banks reassess the outlook for the coronavirus, according to Toronto-Dominion’s Kumra. For now the path is still clear: carry on buying.
Lasciano ai lettori interessati di approfondire gli aspetti più tecnici (anche scrivendo a noi di Recce’d, all’indirizzo che trovate sul sito) resta un messaggio che è chiarissimo per tutti: la bassa volatilità è artificiale, ed è anche un indicatore di scarsa liquidità.
Che cosa potrebbe provocare un brusco stop, o un incidente che metta in evidenza la scarsa liquidità dei mercati obbligazionari?
Semplice: vediamo insieme qualche numero.


Negli Stati Uniti, come anche in tutto il mondo occidentale, la risposta alla crisi economica che si è manifestata fin dalla fine del 2019 (parole di Draghi e di Powell) e che poi è esplosa con la pandemia COVID-19 è stata affidata alla crescita (esplosiva) dei debiti. A fronte di un PIL in netto calo, è quindi esploso anche il rapporto tra debito e PIL.
Come abbiamo già scritto più in alto, per ogni unità di debito, allo stato delle cose come è oggi, c’è quindi meno valore sella produzione. Di fatto, il valore del debito è già stato ridotto. La scelta delle Banche Centrali (che proprio in questo senso sono le nemiche di tutti noi investitori) è stato quello di garantire a questo debito un valore del tutto artificiale, slegato dalla realtà: lo hanno fatto acquistando loro stesse i titoli, con denaro di nuova creazione, ovvero con denaro che prima non esisteva.

La medesima cosa si riscontra se si mettono a confronto (grafico sopra) i prezzi di Borsa e la crescita del fatturato delle aziende quotate in Borsa. La mancanza di collegamento tra i prezzi e la realtà dell’economia è evidente.
Come si legge nell’immagine in basso, le Banche Centrali medesime riconoscono che è questo il principale effetto delle loro politiche sconsiderate, e riconoscono al tempo stesso la fragilità estrema di questa situazione, affermando che “potrebbero verificarsi improvvisi e violenti aggiustamenti dei prezzi di azioni ed obbligazioni”.

A questo tema, nelle ultime settimane, ne è stato collegato un secondo: la perdita del valore di cambio del dollaro USA ha fatto parlare, e scrivere, molto di “debasement”, ovvero di una politica esplicitamente finalizzata a fare crollare il potere di acquisto della valuta americana.
Per ragioni diverse, Recce’d non ritiene che la teoria del “debasement” sia fondata. In un altro Longform’d ne scriveremo con dettaglio., Oggi e qui, non c’è il tempo né lo spazio. Ci apre però utile segnalare al lettore che di questo si parla molto, e si parlerà molto, tra operatori di mercato e giornalisti specializzati in giro per il Mondo.
A titolo di esempio, di seguito portiamo alla vostra attenzione un commento di Bank of America Merrill Lynch
BofA's CIO Michael Hartnett also could not resist the temptation of commenting on the dollar, and in his latest weekly Flow Show note, discussed what is rapidly emerging as the biggest story of 2020.
But before we get there, here is Hartnett on 2020, first looking at the year in numbers:
Covid-19 deaths >670k
Global GDP loss $10tn
US claims >50mn
US budget deficit >40% of Q2 GDP
MOVE index all-time low
Cash on sidelines $5tn,
US corporates raise $2.7tn,
Global stock market cap crashes $30tn, then $25tn rally.
... then in terms of returns, where gold not surprisingly is the best performing asset:
... and then, tying it all together, showing why $20 trillion is the most important number for 2020: that, as the BofA strategist explains, is the total in global policy stimulus unleashed so far in 2020 and consisting of $8.5TN in monetary and $11.4TN Fiscal stimulus (it does not include any of the Phase IV US fiscal stimulus which Congress is fighting over now).

With this fiscal and monetary tsunami it is hardly a surprise that investors are flocking to the deflationary safety of gold and bonds, and dumping the currency in which all this new liquidity is being created out of thin air, the dollar.
As Hartnett puts it, when looking at dollar bear markets, new highs in gold tends to emerge on "dollar debasement" themes, and notes the two great dollar bear markets were in 1970s & 2000s, with outperforming assets those decades were EM equities, commodities, small cap, and value stocks.
Of course, gold - as a "hard" currency - is expected to outperform everything, and sure enough recent inflows into gold funds are off the charts, with $16.7BN allocated over the past 6 weeks, with other notable fund flows include a credit surge: $210bn with a record 12-week inflow to IG, HY and EM bonds), $75.9BN out of money-market funds in the past 11 weeks after $1.2tn inflow.

Meanwhile, as Hartnett explains looking at BofA private clients, there is a lot more gold buying on deck: the current asset allocation is 58.7% equities, 22.0% debt, 13.0% cash, reducing cash holdings for 3 consecutive weeks (first time in 2020 – Chart 5); At the same time, their precious metal ETF holdings % ETF portfolio on rise (2.3%) but well below 9.3% peak of 2012. So they can and will buy a whole lot more.
Fund flows aside and gold surge aside, Hartnett takes a step back to observe the bigger stories of the year unleashed by dollar debasement, which include:
the coming era of bigger government, smaller world,
unconventional fiscal policy accelerated by pandemic, heralded by higher gold & weaker US dollar, best positioned for via commodities, HY bonds, and long RoW stocks vs US stocks;
2010s were decade of liquidity, globalization, profits;
2020s to be decade of deficits, localization, redistribution;
War on Inequality means unconventional monetary policy of 2010s to be replaced by unconventional fiscal policies of 2020s…MMT, UBI, debt forgiveness, unionization (Chart 8).
While not central to Hartnett's thesis, he sees two outcomes for markets: a big top in the S&P preceded by a "summer dip."
Big top: 2020 risk asset peak most likely at time of vaccine, full capitulation by bears, higher interest rates (lower US $ + higher yields = risk-off); note history of great bear market rallies predicts SPX 3300-3600 top between Aug-Jan.
Summer dip: summer dip in SPX to 3050 plausible given cross-asset price action on universal belief in interest rate suppression & US$ debasement of US$ (lower $ + lower yields = risk-on); summer trading positives of Fed, tech & credit are peaking

And, as usual, the US dollar is the lead indicator of all major changes because:
US$ = 62% of global FX reserves (Euro = 20%, JPY = 6%, GBP = 4%, CNY = 2% - Chart 10);
US$ = 45% of global FX reserves in 1992; global FX reserves are $12tn (up $10tn since 2001 – 9/11 & China/WTO – Chart 9);
FX reserve shares of Euro (with EU fiscal union) & China (in Tech War with US) likely to rise vs US.

Meanwhile, the most important asset over the short-term is neither gold, nor dollar, nor risk assets, but oil which is "now key for autumn rotation" as consensus remains stubbornly entrenched in deflationary portfolio: "if higher gold, weaker US dollar (Chart 11) followed by oil >$50/b deflationary positions likely to crack (Chart 12)...
... especially if Fed YCC means bond yields stop undershooting expectations (on average by 100bps since 2008).
Abbiamo citato il debasement perché è nostro dovere professionale essere completi e tempestivi: al contrario della gran parte delle Reti di promotori finanziari e delle banche, riteniamo professionalmente doveroso informare nel dettaglio i Clienti anziché “tenerli tranquilli” nell’ignoranza delle dinamiche rilevanti per i loro investimenti.
Ma, come già anticipato, in Recce’d diamo relativamente poca importanza al tema del debasement, ed una importanza decisamente maggiore al tema del debito, che più in alto abbiamo trattato anche grazie a tre grafici riferiti al debito degli Stati Uniti: che, come avete già letto, per rapporto al PIL oggi è molto vicino a quello dell’Italia (150% secondo le stime più recenti).
Tutto questo ha determinato, da parte dell’Agenzia Fitch, propri la settimana scorsa una revisione al ribasso del “outlook” (delle prospettive) dei Titoli di Stato USA, revisione al ribasso che è stata motivata con le parole che seguono. Alcune delle quali ci dicono molte cose utili anche in chiave operativa.
Ad esempio: vi siete chiesti di quanto aumenterà il debito degli Stati Uniti per ogni aumento dello 1% dei rendimenti delle obbligazioni, in futuro? Ve lo dice Fitch qui sotto.
The U.S. sovereign rating is supported by structural strengths that include the size of the economy, high per capita income and a dynamic business environment. The U.S. benefits from issuing the U.S. dollar, the world's preeminent reserve currency, and from the associated extraordinary financing flexibility, which has been highlighted once again by developments since March 2020. Fitch considers U.S. debt tolerance to be higher than that of other 'AAA' sovereigns.
However, the Outlook has been revised to Negative to reflect the ongoing deterioration in the U.S. public finances and the absence of a credible fiscal consolidation plan, issues that were highlighted in the agency's last rating review on March 26, 2020. High fiscal deficits and debt were already on a rising medium-term path even before the onset of the huge economic shock precipitated by the coronavirus. They have started to erode the traditional credit strengths of the US. Financing flexibility, assisted by Federal Reserve intervention to restore liquidity to financial markets, does not entirely dispel risks to medium-term debt sustainability, and there is a growing risk that U.S. policymakers will not consolidate public finances sufficiently to stabilize public debt after the pandemic shock has passed. Although a massive policy response has prevented a deeper downturn - such that Fitch expects a less severe contraction in the U.S. in 2020 than in many other advanced economies - the agency has revised down our macroeconomic projections since March and downside risks persist.
The U.S. had the highest government debt of any AAA-rated sovereign heading into the crisis, and Fitch expects general government debt to exceed 130% of GDP by 2021. Fitch's debt dynamics analysis indicates that debt/GDP could stabilize temporarily from 2023 if fiscal balances return to pre-pandemic levels, but only assuming that interest rates stay very low. Health and social security costs are still set to rise over the medium-term while federal revenue in FY19 was close to its long-term average as a share of GDP.
Fitch expects the general government calendar year deficit to widen to over 20% of GDP in 2020. The agency expects the deficit to narrow to 11% of GDP in 2021 as economic support measures are rolled back. The cumulative federal deficit in the first nine months of FY20 (starting in October 2019) reached USD2.7 trillion, compared with USD747 billion in the same period of FY19. Spending rose by USD1.6 trillion, or by 49%. The Congressional Budget Office (CBO) estimated in April that the federal deficit would reach USD3.7 trillion in FY20. In the three months since this CBO estimate was published, Congress has made no major addition to the support packages. However, with Congress considering a further round of fiscal stimulus (Senate Republicans' draft Health, Economic Assistance, Liability Protection, and Schools (HEALS) Act would provide further transfers to households and extend supplementary federal unemployment benefits at a reduced level), Fitch assumes that a further USD1 trillion in measures will be passed in August to be spread over FY20 and FY21.
The U.S. government has once again demonstrated exceptional financing flexibility, borrowing just under $3 trillion between the end of February and the end of June, of which USD2.5 trillion was in the form of treasury bills, while the Fed has intervened to backstop financial markets (expanding its balance sheet by USD2.6 trillion since mid-March) and boost global dollar liquidity. Amid a borrowing surge, borrowing costs have fallen, with the 10-year treasury bond yielding 0.6%. Marginal government borrowing costs currently average below 1% for up to 20 years. The effective interest rate on the federal government debt stock fell (by 0.75 percentage points (pp) compared with a year ago) to 1.75% by June 2020, and should continue to fall.
In line with our assumption that the Federal Reserve will hold its policy rate at 0.25%, Fitch expects negative real interest rates to provide some support to public debt dynamics. If real growth also reverted to 2%, a debt stabilizing primary deficit for the general government by 2024 could be around 3%-4% of GDP, comparable with 2019 levels. But it is uncertain whether very low market rates will persist once growth and inflation pick up. At current levels of indebtedness, a 1% rise in the effective rate on the debt would add 1.2% of GDP to the interest bill in a single year.
Come già anticipato, questi nostri documenti Logform’d hanno l’obiettivo preciso di offrire al lettore una panoramica che sia non soltanto completa ma pure analitica, che presenti con ordine al lettore tutti gli elementi di giudizio, e che metta il lettore nella condizione di capire se i suoi investimenti attuali poggiano su basi solide e su scelte fatte in modo consapevole, e con tutte le necessario informazioni.
Abbiamo documentato in questo lavoro le ragioni per le quali Recce’d ritiene utile mettervi in guardia contro il principale nemico del vostro benessere finanziario: le Banche Centrali.

Scegliamo di chiudere il lavoro con il parere dello strategista di Bloomberg sugli argomenti toccati dal nostro Post.
Il taglio di questo ultimo contributo è maggiormente orientato all’operatività. Potrebbe aiutare i lettori a capire. Capire i rischi che corrono, ma pure capire le notevoli opportunità, per portafogli che siano gestiti in modo attivo e totalmente diverso da quello suggerito dalle tradizionali Reti di vendita o dai robo-advisors.
Viene citata, prevedibilmente,l’esperienza del Giappone: vi invitiamo a dare uno sguardo ai rendimenti degli investitori in Giappone, e poi di pensare al vostro futuro a 1, 3, 5, 10 anni..
Vi chiediamo inoltre di notare i ripetuti accenni al tema della stagflazione, e quindi degli Anni Settanta. sarà un tema dominante, nei prossimi 12 mesi, e sarà un tema al quale Recce’d dedicherà un altro Longform’d.
With no imminent end to collapsing real yields - which just hit a new record low -1.10%, the side effects of financial repression warn of stagflation, asset bubbles and policy impotence. Fresh lows for U.S. 10-year real yields this week show a trap door opened by growing economic angst, climbing inflation expectations and an indefinite pause in monetary policy.
The Fed’s explicit guidance that rates will stay near zero for the foreseeable future has markets pricing a hold until at least 2023, effectively killing price discovery.
When it comes to bond purchases, the central bank will likely have to skew buying to the longer-end to aid the recovery. That, combined with the search for yield, risks pushing yields on the entire U.S. curve below 1%, a threshold breached only briefly in March.
Not even the record-shattering supply announced on Wednesday is likely to lift yields, with insatiable appetite for safety and the seeds of debt monetization planted.

Meanwhile, inflation expectations have room to rise, with U.S. 10-year breakevens about 20bps shy of the 2020 peak. They could get a boost should questions ring louder over the Fed relaxing its inflation mandate, which has been in place since January 2012.
Fed Chairman Powell alluded to tweaking the price-stability mandate in the forthcoming policy review, while member Brainard coined the “opportunistic reflation” strategy to explicitly welcome an inflation overshoot. Such a stance would be a material departure for the Fed, given policy lags of at least one year.
Should markets believe the Fed will do what it takes for inflation to go beyond 2% in pursuit of full employment, then in theory 10-year U.S. real yields could tumble 40bps-50bps more from roughly -1.07% currently. That’s assuming nominal yields remain range-bound, and would be well below the estimated real neutral rate
That opens the door to risks such as stagflation -- a more plausible scenario now given the unique combination of unprecedented monetary and fiscal stimulus; a deglobalization trend that’s creating supply constraints; and elevated unemployment that’s quashing hopefor a quick economic recovery.
The tumble in real yields is also amplifying the bifurcation between the real economy and financial assets. While market-based inflation measures ramp up, firms that lack pricing power and absent wage negotiations are keeping alive the risks of a deflationary spiral.
The Bank of Japan offers a cautionary tale on the pitfalls of revising inflation mandates, which it did in January 2013 to combat chronic deflation. A more than trebling of its balance sheet, negative rates, forward guidance and ETF purchases failed to spur price growth.
The Fed itself examined the Japan experience in a study earlier this year. Lessons include that the central bank faces the risk of getting caught in “never-ending monetary accommodation even when real economic activity is strong or when financial stability risks accumulate.”
To be sure, the widespread decline in real yields has been in place for decades and has been driven by structural factors such as a demographic-driven propensity to save and the integration of Chinese investors into global financial markets. Yet this time around, financial repression has taken over real yields and further declines would only amplify the many risks ahead.