
Facciamo un po' di Accademia (parte 6)
Nel secondo Post di questa serie, abbiamo scritto che il rischio che ognuno di noi e di voi detiene nel proprio portafoglio di investimenti deve essere misurato con strumenti efficienti, che guardano in avanti, succedendo quindi a chi ci legge di mettere del tutto da parte tutta la vecchia strumentazione (basata sulle volatilità storiche) e chi ancora la usa per calcolare presunti "profili di rischio" che alla prova pratica fanno più male che bene.
E' curioso leggere, proprio questa mattina, una ricerca di Citigroup che è dedicata poprio a questo tema, che viene trattato con queste parole:
… it is not really volatility that we should be watching if we want to try and predict turns in risk appetite, it is the shape of the distribution of the price action in markets. The chart below shows an index based on the distribution of weekly changes in price for a blended index of equities, rates, fx and commodities.
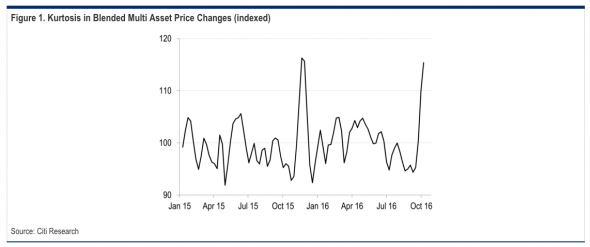
It is worth considering that the spike in November 2015 peaked just as the equity markets turned, leading to a 15% reversal in global stock markets that lasted for three months.
We are not suggesting that a similar move is imminent, but we would caution that recent price action suggests that confidence might be waning. A big reversal will still require a trigger, but it might only need to be a small trigger.