2020 in dettaglio: i sogni, il risveglio, ed una concreta strategia di investimento
 

Chi sia Mohamed El Erian i nostri lettori lo sanno da un decennio, e altri lettori lo hanno scoperto più di recente, quando lo hanno ritrovato in prima pagina sul Corriere della Sera (nel 2019, come abbiamo raccontato qui nel Post.

Noi utilizzeremo alcuni brani di una sua intervista della scorsa settimana per offrire ai lettori del Blog una anticipazione dei temi che ritroveremo nel 2020 come determinanti per la performance dei nostri portafogli.

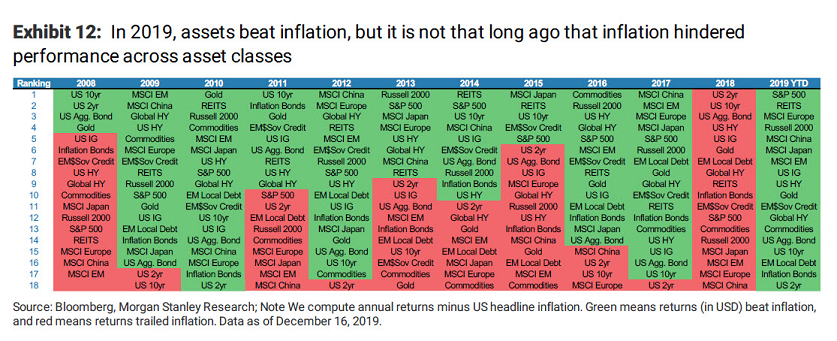
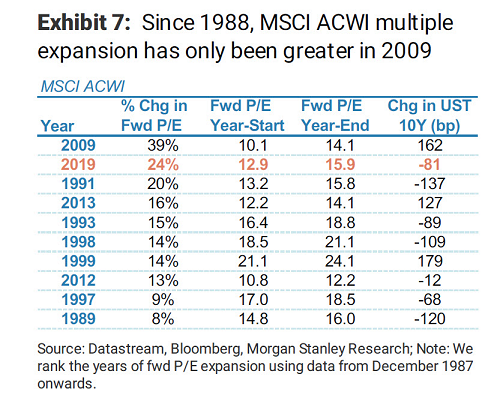
In questo quinto ed ultimo Post, arriviamo alle conclusioni. La chiave di lettura del 2019 è, a nostro parere e non soltanto a nostro parere, che si è trattato di un anno anomalo: anzi, di un anno abnorme. Nel 2019 abbiamo visto, come viene spiegato in modo efficace da El Erian, tre cose che sono impossibili da vedere allo stesso momento. Per questo, è giustificato affermare che i mercati nel 2019 hanno “inseguito un sogno”.

E questa avviamente non è soltanto una considerazione sul passato: è al tempo stesso una fortissima indicazione operativa per il futuro, e per i nostri portafogli in titoli.

Nevertheless, 2019 turned out to be one of the best years ever for investing. What kind of performance can we expect in 2020?
I’ve been calling it «livin' the dream» because we’ve had three things that are almost impossible to get together: One, you’ve had almost a 30% increase in US stock market indices. Two, on the whole, volatility was very low. And three, you’ve also made money on your risk-free assets. So the correlations have broken down, everything has worked for investors. The reason is liquidity: The relaxation of monetary policy by the Federal Reserve and the ECB boosts all asset prices. They’re buying the risk-free assets which pushes investors to buy the risky assets, so everything goes up.

How long can this «dream» go on?
Going forward three or four years, this cannot continue. So this is a very good time to go up in quality: favor strong balance sheets and reduce exposure to illiquid asset classes that could get disrupted, like certain segments of the high yield market and emerging markets corporates. For example, two years ago, Argentina issued a hundred-year bond at 7,9% which was massively oversubscribed. Then, suddenly Argentina went into troubles
and that bond came down quickly to trading at 30 Cents on the Dollar because no one is making the market as the price goes down. That’s because there are two types of investors in these assets: The dedicated investor who understands how these markets function, and «tourist investors» who come in because they’re attracted by the higher yield. The latter don’t understand the higher yield very well but it’s much better than what they get elsewhere. So when a problem occurs, they want to get out at any cost - and that’s why you get this massive gap in prices.

What should a prudent investor do in this kind of market environment?
If you’re like me and expect volatility, you want to have some cash to pick up good opportunities at cheap prices. So as you get rallies, you sell companies with weaker fundamentals and you do two things: You allocate some of that money to attractive opportunities and you build up your cash.
People forget that cash performs multiple functions in a portfolio: First, it performs as a risk mitigation. Especially when yields are so low, it’s important to have cash as a risk mitigator. Second, cash gives you agility. The fourth quarter of 2018 was the perfect example. You could have picked up the big technology firms like Microsoft at very cheap prices. These firms are attractive when they sell-off big because they have very solid balance sheets, they are massive cash generators and they’re in a growing business.

Where else would you watch out for opportunities?
Markets overshoot on the way up and on the way down. That means sell-offs offer opportunities to take advantage of distressed situations trading at bargain prices. For instance, as much as Argentina is distressed, when that Argentine bond was trading at 30 Cents, the market had overshot. Here’s another example: There are Turkish multinational companies with assets outside of Turkey that are very reliant on Turkish banks. Since Turkish banks are lending less, you can lend to these companies with collateral outside of Turkey at double digit interest rates. And then, there is the issue of getting closer to the real economy: We are seeing more and more people co-investing in direct lending vehicles where you can find value as well. So it’s all about slowly re-orienting your portfolio because very short-term I’m constructive.

Mercati oggiValter Buffo
The fool's game: il gioco degli sciocchi
 

Chi sia Stephen Roach lo potete leggere sia alla fine di questo Post, sia sul Web. Noi vi proponiamo di leggere un articolo che Stephen Roach ha pubblicato la settimana scorsa, e che vi fornisce una interpretazione qualificata dei fatti del 2019, del comportamento dei mercati finanziari, e quindi anche di ciò che vedrete nel 2020. In poche righe, troverete tutte le cose più importanti da tenere a mente, quando decidete come investire i vostri soldi. La lingua resta l’inglese, anche in questo caso per restituire a chi legge il senso originale dell’Autore: ci scusiamo per il disagio.

By Stephen S Roach
December 27, 2019 8:01 am GMT

Predicting the next crisis — financial or economic — is a fool’s game.

Yes, every crisis has its hero who correctly warned of what was about to come. And, by definition, the hero was ignored (hence the crisis).

But the record of modern forecasting contains a note of caution: those who correctly predict a crisis rarely get it right again.

The best that economists can do is to assess vulnerability. Looking at imbalances in the real economy or financial markets gives a sense of the potential consequences of a major shock. It doesn't take much to spark corrections in vulnerable economies and markets. But a garden-variety correction is far different from a crisis. The severity of the shock and the degree of vulnerability matter: big shocks to highly vulnerable systems are a recipe for crisis.

In this vein, the source of vulnerability that I worry about the most is the overextended state of central-bank balance sheets. My concern stems from three reasons.

First, central banks’ balance sheets are undeniably stretched. Assets of major central banks — the US Federal Reserve, the European Central Bank, and the Bank of Japan — collectively stood at $14.5tn in November 2019, which is down only slightly from the peak of around $15tn in early 2018 and more than 3.5 times the pre-crisis level of $4tn. A similar conclusion comes from scaling assets by the size of their respective economies: Japan leads the way at 102% of nominal GDP, followed by the ECB at 39%, and the Fed at a mere 17%.

Second, central banks’ balance sheet expansion is essentially a failed policy experiment. Yes, it was successful in putting a floor under collapsing markets over a decade ago, in the depths of the crisis in late 2008 and early 2009. But it failed to achieve traction in sparking vigorous economic recovery.

Central banks believed that what worked during the crisis would work equally well during the recovery. That didn’t happen. The combined nominal GDP of the US, eurozone, and Japan increased by $5.3tn from 2008 to 2018, or only about half their central banks’ combined balance-sheet expansion of $10tn in over the same period. The remaining $4.7tn is the functional equivalent of a massive liquidity injection that has been propping up asset markets over most of the post-crisis era.

Third, steeped in denial, central banks are once again upping the ante on balance-sheet expansion as a means to stimulate flagging economic recoveries. The Fed’s late 2018 pivot led the way, first reversing the planned normalisation of its benchmark policy rate and then allowing its balance sheet to grow again (allegedly for reserve management purposes) following steady reductions from mid-2017 through August 2019. Asset purchases remain at elevated levels for the BOJ as a critical element of the “Abenomics” reflation campaign. And the recently installed ECB president, Christine Lagarde, the world’s newest central banker, was quick to go on the record stressing that European monetary authorities will “turn (over) each and every stone” — which presumably includes the balance sheet.

So why is all this problematic? After all, in a low-inflation era, inflation-targeting central banks seemingly have nothing to fear about continuing to err on the side of extraordinary monetary accommodation, whether conventional (near zero-bound benchmark policy rates) or unconventional (balance-sheet expansion).

The problem lies, in part, with the price-stability mandate itself — a long-standing, but now inappropriate, anchor for monetary policy. The mandate is woefully out of sync with chronically below-target inflation and growing risks to financial stability.

The potential instability of the US equity market is a case in point. According to the widely-cited metrics of Nobel laureate economist Robert Shiller, equity prices relative to cyclically adjusted long-term earnings currently are 53% above their post-1950 average and 21% above the post-crisis average since March 2009. Barring a major reacceleration of economic and earnings growth or a new round of Fed balance-sheet expansion, further sharp increases in US equity markets are unlikely. Conversely, another idiosyncratic shock — or a surprising reacceleration of inflation and a related hike in interest rates — would raise the distinct possibility of a sharp correction in an overvalued US equity market.

The problem also lies in weak real economies that are far too close to their stall speed. The International Monetary Fund recently lowered its estimate for world GDP growth in 2019 to 3% — midway between the 40-year trend of 3.5% and the 2.5% threshold commonly associated with global recessions. As the year comes to a close, real GDP growth in the US is tracking below 2%, and the 2020 growth forecasts for the eurozone and Japan are less than 1%. In other words, the major developed economies are not only flirting with overvalued financial markets and still relying on a failed monetary-policy strategy, but they are also lacking a growth cushion just when they may need it most.

In such a vulnerable world, it would not take much to spark the crisis of 2020. Notwithstanding the risks of playing the fool’s game, three “Ps” are at the top of my list of concerns: protectionism, populism, and political dysfunction. An enduring tilt toward protectionism is particularly troubling, especially in the aftermath of a vacuous “phase one” trade accord between the US and China. Prime Minister Narendra Modi’s “Hindu nation” crusade in India could well be the most disturbing development in a global swing toward populism. And the great American impeachment saga takes Washington’s political dysfunction further into uncharted territory.

Quite possibly, the spark will be something else — or maybe there won’t be any shock at all. But the diagnosis of vulnerability needs to be taken seriously, especially because it can be validated from three perspectives — real economies, financial asset prices, and misguided monetary policy.

Throw a shock into that mix and the crisis of 2020 will quickly be at hand.

Stephen S. Roach, a faculty member at Yale University and former Chairman of Morgan Stanley Asia, is the author of Unbalanced: The Codependency of America and China

Mercati oggiValter Buffo
Per sempre ad un livello più alto
 

La domanda più frequente, che si rincorre tra investitori ed operatori di mercato, è questa: “quanto potrà durare?”.

La riconciliazione tra la realtà dei fatti e il miraggio, o meglio la squeza di miraggi, che si inseguono sui mercati finanziari è inevitabile. Nessuno oggi lo discute: nessuno che abbia ancora un residuo di buon senso.

Eppure, la distanza tra la realtà dei fatti e i numeri sui mercati finanziari, nel 2019, è cresciuta ancora, ed in molti casi in una misura drammatica, che ha emozionato molti e preoccupato molti.

3.png

Quanto può durare, allora? Noi, in Recce’d, non abbiamo una risposta: noi come voi stiamo assistendo a questo “esperimento sociale” che non ha alcun precedente nella storia dei mercati e nella storia delle economie.

Non esistono precedenti di una specie di “pianificazione centralizzata” dei rialzi di mercato, alla quale collaborano di fatto le banche centrali da un lato e i Governi in carica dall’altro. Una serie di manovre di tipo politico che hanno in comune l’obbiettivo di fare salire gli indici dei mercati finanziari, tutti e tutti insieme.

Che si tratti di una mossa disperata, o meglio di un inseime di mosse della disperazione, per tenere insieme un edificio che traballa, questo lo abbiamo già visto, discusso, documentato, e dimostrato con i fatti.

Che questo “esperimento sociale” sia destinato a finire male è certo. Ed è certo perché ormai un finale caotico non è più evitabile, visto il livello di stress che si esprime proprio nei prolungati rialzi degli indici, rialzi a cui nessuno sa più dare un senso, una proporzione, una direzione.

Che sia destinato a finire in tempi brevi, noi in Recce’d lo pensiamo, e riteniamo la cosa più che probabile: ma su questo, ovviamente, non siamo nella condizione di offrire garanzie.

Invitiamo però i nostri lettori a riflettere sul passato: ed oggi, in particolare, proponiamo ai lettori di utilizzare un po’ del loro tempo per investigare la figura e la vicenda di Irving Fisher.

Scienziato dell’economia, e uomo le cui capacità furono riconosciute sia della comunità degli economisti, sia dal mondo della politica e del pubblico in generale, ad Irving Fischer si deve una delle più efficaci teorie delle bolle finanziarie. Ovvero, una delle teorie più efficaci per comprendere come e quando finirà la fase di mercato oggi in corso. La sua teoria è stata chiamata “debt-deflation” e poco più sotto ve ne offriamo una sintesi estrema, lasciando poi ai nostri lettori di approfondire come meglio credono (le fonti sono moltissime).

Purtroppo per Irving Fisher, la sua intera vicenda umana e professionale è però legata, per il grande pubblico, ad un altro fatto.

Tutte le persone, in tutto il Mondo, ricordano Irving Fisher per avere pronunciato la frase “a permanetly high plateau” ("reached what looks like a permanently high plateau.” ) . La frase esprimeva questo concetto: la Borsa di New York si è ormai assestata, in modo permanente, ad un livello più alto, da cui non scenderà più (perché non si torna mai indietro).

Questa frase celeberriama di Fisher a noi ne ricorda moltissime altre, che abbiamo ascoltato di recente, e che dicono che il Mondo ormai è cambiato, che i mercati finanziari ormai sono cambiati, che le valutazioni ormai non contano, che le Banche Centrali dispongono di un potere sovra-umano a cui noi umani possiamo soltanto soggiacere, che ormai siamo entrati in una fase del tutto nuova della storia economica.

Perché si diffonde un atteggiamento di questi tipo, tra il fatalista e il catastrofista?

Ci aiuterà a comprenderlo la vicenda professionale ed umana proprio di Iriving Fisher: il quale pronunciò quella frase che abbiamo riportato in alto 9 gionri prima del crollo del mercato azionario di New York nel 1929, crollo che prese avvio con tre sedute nelle quali i ribassi furono rispettivamente del 10% (il venerdì), del 12% (il lunedì), e poi ancora del 10% (il martedì).

La Borsa di New York rivedrà i livelli del 1929 soltanto dopo 30 e più anni.

A posteriori, Fisher si sbagliava: ma allora, in quel preciso momento?

Si trattava certamente di una persona lucida, di una persona informata, e di una persona istruita e con una grande reputazione in campo economico e finanziario.

Anche i nostri lettori sono lucidi, informati ed istruiti.

Ma è chiaro che la pressione alla lunga esaspera, l’attesa tende i nervi, logora, riduce la lucidità. Così come è chiaro che i rialzi di mercato prolungati nel tempo obbligano a farsi delle domande ed a mettere in dubbio le proprie convinzioni, e a volte per chi non dispone di sufficiente pazienza e di sufficiente tenuta nervosa impongono di dire qualcosa, o peggio di fare qualcosa, per “non stare soltanto lì a guardare”.

Nel 1929, la crisi portò via dal mercato azionario di New York lo 80% del valore dell’indice: oggi, secondo alcuni, questo risulterebbe impossibile, perché sono stati introdotti nuovi “meccanismi automatici di stabilizzazione”.

Noi vogliamo ricordare a tutti i lettori che questi meccanismi di stabilizzazione sono stati sviluppati e testati sulla base dei problemi del passato. E si può essere certi che se comparissero problemi seri sui mercati finanziari, questi NON avrebbero la medesima forma che assunsero in passato. Voi lettori, nel 2008, neppure sapevate con certezza dell’esistenza dei “subprime loans”, giusto?

Chiudiamo il Post ricollegandoci al punto di cui abbiamo fatto cenno più in alto: la teoria della debt-deflation di Irving Fisher, che potrebbe aiutarvi a riflettere su dove ci troviamo in questo momento, e dove ci troveremo fra non molto tempo. Vi invitiamo ad approfondire , utilizzando anche altre fonti.

Following the stock market crash of 1929, and in light of the ensuing Great Depression, Fisher developed a theory of economic crises called debt-deflation, which attributed the crises to the bursting of a credit bubble. Initially, during the upswing over-confident economic agents are lured by the prospect of high profits to increase their debt in order to leverage their gains. According to Fisher, once the credit bubble bursts, this unleashes a series of effects that have serious negative impact on the real economy:

  1. Debt liquidation and distress selling.

  2. Contraction of the money supply as bank loans are paid off.

  3. A fall in the level of asset prices.

  4. A still greater fall in the net worth of businesses, precipitating bankruptcies.

  5. A fall in profits.

  6. A reduction in output, in trade and in employment.

  7. Pessimism and loss of confidence.

  8. Hoarding of money.

  9. A fall in nominal interest rates and a rise in deflation-adjusted interest rates.

Crucially, as debtors try to liquidate or pay off their nominal debt, the fall of prices caused by this defeats the very attempt to reduce the real burden of debt. Thus, while repayment reduces the amount of money owed, this does not happen fast enough since the real value of the dollar now rises ('swelling of the dollar').

Mercati oggiValter Buffo
Il decennio del dimenticare
 

Come sempre facciamo, per rispetto sia dei nostri lettori sia del nostro lavoro, ci presenteremo con i numeri a consuntivo appena inizierà il nuovo anno.

Oggi, però, ci siamo dati uno scopo diverso: la nostra intenzione è quella di restituire ai nostri lettori il senso, la sintesi estrema, il significato delle molte cose che hanno seguito, letto ed analizzato con noi nel 2019.

week_04_Dec_2019_002.png

Abbiamo fatto, durante questo weekend un attento lavoro di selezione, e dopo un prolungato dibattito abbiamo scelto l’articolo che segue.

week_04_Dec_2019_001.png

Si tratta di un articolo del Wall Street Journal: una fonte che nessuno, tra i nostri lettori, potrà certo accusare di negatività, pessimismo, disfattismo oppure di avere pregiudizi contro Donald J. Trump. Ed un’autore, Jason Zweig, dalla reputazione ampia quanto la sua fama nel Mondo degli investimenti.

Non ci sentiamo di aggiungere commenti all’articolo: il tema è un tema che Recce’d ha già affrontato in passato. Ovvero: la memoria straordinariamente corta di quasi tutti gli investitori, che mostrano in modo curioso ad ondate sempre più frequenti una sorta di “tendenza suicida collettiva”.

Sono sufficienti 12 mesi di rialzi, per fare ritornare sulle labbra di molti la frase “hanno guadagnato tutti”, e buttarsi come accecati alla rincorsa di un qualche cosa che però, nella realtà, non esiste. Ed è pure semplice da dimostrare, che non esiste. Noi ve lo abbiamo dimostrato, anche in questo Blog.

L’articolo che leggete qui sotto è in inglese: come sempre, vogliamo presentarvelo nella sua integrità, senza aggiungere oppure togliere nulla. Come sempre, chiediamo al lettore che ha poca dimestichezza con l’inglese, di fare un piccolo sforzo.

Non è un grande sforzo: ormai, che le tasse si chiamano “sugar tax” e “plastic tax” (e non ce ne sarebbe alcun bisogno), volte proprio arrabbiarvi con noi di Recce’d per l’inglese? Siate buoni, dai, che è Natale.

If 2000-2009 was the Lost Decade for investors, 2010-2019 was the Decade of Forgetting.

In March 2008, E.S. Browning wrote for The Wall Street Journal that “we may be in another lost decade” for stocks, like the Great Depression and the 1970s. He was right. Stock investors had their wealth slashed in half twice, in 2000-02 and 2007-09. All told, the S&P 500 had an average annual total return of negative 0.95% from 2000 through 2009. To end the decade barely below where they had started, investors had to endure a brutal battering along the way.

Financial markets tend to base their expectations of the future on the experiences of the recent past. At the end of 2009, investors looking back on the prior decade saw that U.S. stocks had gone nowhere; value shares had outperformed growth; small stocks had done better than large; international stocks had beaten U.S. companies; emerging markets had earned higher returns than developed countries.

At year-end 2009, most investors—individuals and professionals alike—expected interest rates to rise, inflation to return, the dollar to weaken, commodities to boom and U.S. stocks to struggle. The giant investment firm Pacific Investment Management Co. and its then-influential co-founder Bill Gross were actively promoting their scenario of “the new normal,” which they described as “likely to be a significantly lower-returning world” for stocks and bonds alike for years to come. (Mr. Gross left Pimco in 2014 and retired from money management earlier this year.)

Instead, over the ensuing 10 years, interest rates fell to historic lows, inflation all but vanished, the dollar strengthened, commodities languished, and U.S. stocks earned among the highest returns they have produced in any decade. What’s more, bonds did well, growth stocks beat value, large stocks beat small, and shares from the rest of the world lagged far behind the U.S.

Investors en masse pulled money out of active funds run by people trying to pick the best stocks or bonds, and poured cash into passive funds run by computers holding everything in a market index. Over the decade, according to Morningstar, investors withdrew more than $160 billion from all active funds combined, while adding more than $3.76 trillion to index funds.

Even so, surprises lurked everywhere. From the market low on March 9, 2009, through the end of that year, the MSCI Emerging Markets index gained 108%. Lured by that spectacular return, investors poured nearly $180 billion into mutual funds and exchange-traded funds specializing in stocks and bonds from developing nations between the end of 2009 and the beginning of 2013, according to data from Morningstar.

Emerging markets proceeded to underperform U.S. stocks by nearly 10 percentage points a year this decade through Dec. 12. Also striking: The MSCI Emerging Markets index has generated a cumulative total return of 42.3% since Dec. 31, 2009—less than half its return from the March 2009 low through the end of that year.

Most investors would likely feel foolish remembering how thoroughly their expectations ended up being repudiated by reality. So they got busy forgetting—both what they expected and what they experienced.

You might have, too. Ask yourself this question, without pausing to deliberate or look up any numbers: How much did my stock portfolio lose during the global financial crisis?

If you’re like most investors I’ve posed that question to over the past few years, you probably answered with something like a 20% to 25% loss.

Yet, from the peak in October 2007 to the bottom in March 2009, U.S. stocks collapsed by 55%; stocks in the rest of the world crashed 59%. (Those numbers include reinvested dividends.) It’s understandable why investors might have blocked such negative memories.

In a 2018 survey for Legg Mason Global Investors, 14% of U.S. respondents said they would invest more in stocks if there were another global market crash on the scale of 2008-09. An additional 28% said they would either “do nothing” or review their investments but not change them.

If your memory minimizes how much you lost in the last bear market, you can easily overestimate how brave you will be in the next one.

Mutual-fund investors, too, have been shown to exaggerate their past returns in both bull and bear markets.

Viewing the past through a rearview mirror made of rose-colored glass is what psychologists call a “positive illusion”: a behavior that helps you sustain your confidence, even if it might not be fully warranted.

That may be good for your mental well-being, but it is likely to be hazardous to your portfolio’s health.

If you forget how eagerly you embraced the market’s most popular strategies a decade ago—small stocks, value stocks, emerging markets, commodities, hedge funds and other “alternative” strategies—then you might be prone to pitches for today’s hottest approaches.

Naturally, many of those are the exact opposite of the prevailing trends from 10 years ago. Nowadays, large U.S. stocks and growth stocks are all the rage. Hedge funds have faded, and foreign investing is less fashionable. Buyout funds run by private-equity firms and venture-capital funds investing in startups are hot. Most investors still flock toward whatever has been working well lately.

Market patterns don’t reverse in 10-year cycles like clockwork; there’s no guarantee that the coming decade will be the opposite of the one that just ended. But before you bet that the future will be like the past, it’s worth remembering that this decade hasn’t turned out the way investors predicted it would 10 years ago.

Mr. Zweig writes The Wall Street Journal’s Intelligent Investor column. He can be reached at intelligentinvestor@wsj.com.

Mercati oggiValter Buffo
E' cemento oppure è sabbia?
 
week_04_Dec_2019_004.png

In un finale di anno nel quale l’Italia ha sofferto un maltempo eccezionale in molte sue parti, è ritornata sulle prime pagine di tutti i quotidiani la questione della solidità dei viadotti autostradali, anche a causa di un nuovo crollo sull’Autostrada A26 Torino - Savona.

Sono in motli ad interrogarsi sulla solidità dei viadotti autostradali, e non soltanto di quelli della Liguria, ovviamente.

Il punto è comprendere se sono stati costruiti correttamente, se sono stati effetuati tutti i test di sicurezza, e se i materiali utilizzati sono adeguati. E’ tutto cemento, oppure cemento misto a sabbia, utilizzata per risparmiare, per scopo di lucro?

Queste domande sono opportune ed appropriate, anche se sarebbe stato molto più utile interrogarsi prima delle diverse tragedie che hanno colpito il nostro Paese.

Queste domande dovrebbero essere in cima alla lista delle domande che si fanno anche gli investitori a proposito dei loro investimenti.

Sto investendo in qualche cosa che poggia su pilastri solidi, oppure sto investendo su un castello di sabbia?

Piangere dopo, sul latte versato, sarebbe ovviamente inutile.

Recce’d ha già offerto, a questo proposito, spunti di informazione molto utili e pertinenti, ai propri lettori.

Quello di oggi, che vale a consuntivo di un anno come minimo bizzarro, è però qualche cosa che non ricordiamo di avere mai incontrato, nella nostra esperienza pluri-decennale di gestione dei portafogli dei Clienti.

In alto, l’immagine vi invita a riflettere sul fatto che l’intero rialzo della Borsa di New York, nel 2019, deriva da un ampliamento dei multipli: che vuole dire che il rialzo dei prezzi dei titoli non riflette alcun miglioramento dei dati, ma dipende unicamente dal fatto che gli investitori (QUEGLI investitori, non noi) hanno accettato di pagare ancora più cari i titoli azionari (che erano già carissimi, ad inizio anno), e non soltanto negli Stati Uniti, ma nell’intero Mondo cosiddetto Sviluppato.

Vi stiamo descrivendo la realtà: altri, invece, con regolarità da bravo venditore vi raccontano fantasie e sogni (i loro sogni: non sono i vostri sogni, fate semplicemente sognare loro).

In basso potete vedere facilmente le tendenze in atto, per le diverse categorie di azioni, sulla Borsa di New York: il dato che vedete rappresentato nei quattro riquadri è la previsione (fatta dagli stessi analisti delle banche globali di investimento) per gli utili futuri.

Notate in particolare la previsione di lungo termine, che vedete a destra ed in basso.

Ma lasciamo parlare le due immagini, che NON sono difficili da comprendere ed analizzare. Per gli opportuni approfondimenti, siete rimandati al nostro quotidiano bollettino di informzione ed analisi, che si chiama The Morning Brief, che dedichiamo ai nostri Clienti e che viene trasmesso ogni mattina.

week_03_Dec_2019_009ter.png
Mercati oggiValter Buffo