
Longform'd. Costruire valore nel tempo: in Borsa è possibile?
Quello che vi presentiamo in questo Post è una anteprima. La terza, dopo quella che avete visto nel mese di agosto, e quella che è stata pubblicata nel Blog una settimana fa.
In questo Post, potete infatti vedere il formato di una nostra nuova serie di pubblicazioni. La nuova serie, che si chiama appunto Longform’d), fa parte di un certo numero di nuove iniziative di comunicazione che Recce’d lancerà nel prossimo trimestre.
Nel Longform’d, noi manterremo il nostro solito stile, asciutto, to the point e legato all’attualità dei mercati finanziari: ma andremo più a fondo. La situazione nella quale investiamo i nostri soldi è senza precedenti, e richiede analisi di maggiore ampiezza e profondità: tutto ormai è correlato.
Non troverete alcuna indicazione operativa in Longform’d: quelle sono ovviamente riservate ai nostri Clienti.
Si tratta di un tipo di analisi che oggi non potete trovare in alcuna altra sede. Non lo trovate leggendo i quotidiani, oppure seguendo le TV specializzate, e soprattutto non lo trovate nel materiale pubblicitario delle Reti che vendono Fondi Comuni.
Per i primi episodi, questi Longform’d verranno messi in modo gratuito a disposizione del pubblico.
Poi, sarà introdotta una formula a pagamento: sia perché il lavoro si paga, sia per scoraggiare i perditempo, sia per non fare un favore ai venditori, che ogni giorno sono alla disperata ricerca di un nuovo argomento per “piazzare la merce”.

Negli Anni Sessanta e Settanta, spopolavano personaggi come James Bond. Oggi, i quotidiani in Italia riportano in posizioni grande evidenza ciò che accade alla casa del Grande Fratello-
E sui mercati finanziari, come alla TV oppure sul Corriere e su Repubblica, oggi prevale il Grande Fratello.
Il Grande Fratello, in TV, è assurto nel corso degli anni a simbolo (uno dei) del trionfo del cosiddetto trash. Il pubblico oggi ama il trash, più di Sean Connery.
E quella è una scelta spontanea.
Sui mercati finanziari al contrario l’amore per il trash è stato indotto. Undici anni di politiche forsennate e sciagurate delle Banche Centrali hanno prodotto una situazione nella quale il mercato ricorre il trash: il pubblico dei risparmiatori si sente obbligato a concentrare le proprie attenzioni sulla parte più bassa della scala dei valori (come documenteremo in chiusura di questo Longform’d).
Più un titolo è di scarsa qualità, più un titolo è spazzatura, più fa gola. In tutti i comparti, dalle azioni ai Titoli di Stato alle obbligazioni corporate, fino al settore immobiliare.
Per chi intende l’attività di investimento come la ricerca del valore che si mantiene e si costruisce nel tempo, sono anni duri e difficili. O meglio, lo sono stati: perché quella fase è di fatto già finita.
La carica dirompente degli eventi che i mercati sono obbligati ad affrontare, da qui al prossimo futuro, è destinata a rompere quell’equilibrio, a sconvolgere quelle consuetudini, e a modificare radicalmente il panorama.
Cambieranno i mercati. Cambieranno le istituzioni. Cambieranno le Aziende, le Società attive nel settore del risparmio. Cambieranno i media, i mezzi di comunicazione.
Il processo non sarà senza sofferenza: e per molti, sarà una profonda sofferenza. Per altri, per chi già oggi è consapevole, sarà invece una stagione di grandi guadagno, di magnifiche opportunità.
Abbiamo detto della carica dirompente degli eventi: la settimana che inizia domani, 2 novembre 2020, offre un esempio eccellente a questo proposito.
Key events of the coming week include the U.S. election results on Tuesday, an update from the Federal Reserve at its Wednesday and Thursday meeting, and the jobs report for October from the U.S. Labor Department on Friday.
“Next week is going to be a volatile week for the market given all the big events,” Lindsey Bell, chief investment strategist at Ally Invest, told MarketWatch.
Will Trump overcome betting odds and the opinion polls to stage a comeback in the electoral college against Biden as he did in 2016? Or will the Congressional races amount to a so-called blue wave in Washington, resulting in a Democratic sweep of both the White House and Congress that may usher in another broad fiscal relief package to combat the economic harm from the pandemic ?
“If the Democrats gain a strong majority in the Senate there is likely to be more legislation that will affect the markets and there will be sentiment shifts in many sectors of the market,” Franklin Templeton’s Dover explained.
Specifically, Dover thinks the congressional races could prove a source of jitters for markets into late November and beyond, pressuring stocks lower.
“It is likely that we will not know the final Senate results on Tuesday evening,” Dover told MarketWatch, while warning that uncertainty could “add to volatility in the market until resolved which, because of runoff races, might not be resolved until January.”
It is a point that can’t be overstated: the investment community hates the unknown.
Ally Invest’s Bell ranks the political race as the key issue next week, perhaps even above the second or third wave of COVID-19 cases in the U.S. and in major cities in Europe.
“I believe the election will be the key driver of next week’s action,” Bell said. “That’s because the election has the most consequential near-term and long-term implications for the market,” she said, while pointing out that investors will be looking to adjust their portfolios based on its outcome.
However, Katie Nixon, chief investment officer at Northern Trust Wealth Management, views the deadly pandemic as trumping all other market risk factors.
“Given the global ‘risk off’ tone of the market this week, it is clear that the rise in Covid-19 cases across Europe and the U.S. has taken center stage in terms of key risk factors,” she wrote in a Friday research note.
“With memories of March and April fresh in investors’ minds, many are fearful of a repeat, and this fear has been supported by the announcement of various restrictive measures taken across Europe.”
Against that backdrop, the Federal Reserve’s two-day Nov. 4-5 policy meeting and the nonfarm payrolls report on Friday, usually a pivotal market driver, could end up being a sideshow to the election and the coronavirus.
The barrage of factors already has investors bracing for wild swings in the coming week. The Cboe Volatility Index , a gauge of implied moves in the stock market, soared to the highest level since around June, closing Friday out at around 38.02, or well above its historical average at around 19. The volatility index tends to rise when markets fall, therefore can be used by some traders as a hedge against coming equity market drops.
Could there be a big tumble coming, considering the treacherous wall of worry markets must scale now? Northern Trust’s Nixon, doesn’t think so.
“This is unlikely for a few key reasons: First, the panic during March was exacerbated by the tremendous uncertainty related to the virus. We know more today about the epidemiology, we have more advanced and effective treatments, and we sit perhaps weeks away from the announcement of a vaccine,” she explained.
Independent market technician Mark Newton thinks otherwise and sees November and parts of December as vulnerable to post-election rockiness.
“Markets are likely to fall into late [November] or even Dec 21-22, but could have a reprieve from Wed-Friday where bounces are possible,” the market technician said. But he also sees late November as potentially ripe for a “particularly bearish” run for equities.
“Lots of volatility and [I] wouldn’t’ be surprised to see SPX 2900,” Newton wrote.
Furthermore, Newton speculates that new highs for stocks won’t be achieved in 2020 and sees a high likelihood of a contested election, which many expect because of the slow process of counting mail-in ballots, among other issues.
But after the uncertainty lifts, perhaps, there will be a newfound path forward for investors over the longer term, as Bell at Ally Invest expects.
“Right now, we’re bracing for more rough days ahead, but we’re feeling good about the earnings outlook. Earnings can help drive the market after this particular storm, too,” the analyst explained.
“Believe it or not, reports from nearly 60% of S&P 500 companies have shown that U.S. companies are in the midst of a comeback,” she said, adding that “2021 continues to look promising.”
Nel brano che avete appena letto, si associano nel modo che è tradizionale, ed al quale siete tutti abituati, gli eventi (importanti, ed anche drammatici) della settimana prossima con le prospettive dei mercati finanziari.
Si tratta di una consuetudine, di un modo come detto tradizionale di scrivere di mercati: si tratta di qualcosa che , come dimostra l’esperienza degli ultimi decenni, è del tutto inutile e serve unicamente a tenere l’investitore finale interessato, e distratto.
Distratto da che cosa? Dalle questioni di sostanza, quelle questioni che né il giornalista né il venditore di Fondi Comuni sono in grado di affrontare.
Anche a questo proposito, Recce’d prende una posizione diametralmente opposta alla massa. A Recce’d non interessa per nulla “intrattenere il lettore”, e come sapete Recce’d non ha “prodotti finanziari da piazzare”: per questa ragione, il giocherello di “quali titoli comperare se vince Trump” oppure “la Borsa sale o scende se vince Biden”, ci lascia del tutto indifferenti, e disinteressati. Quel tipo di tarantella commerciale, svliluppata nel corso degli anni per creare confusione nella mente degli investitori (e poterne in ogni caso uscire divendo “avevo ragione”) non ci interessa.
Non vi scriveremo quindi, oggi 1 novembre 2020, di Trump e Biden, né del COVID-19, né degli altri argomenti da prima pagina. Invece, richiameremo la vostra attenzione su ciò che a voi davvero serve, per formulare una strategia di investimento vincente per i prossimi anni.
Come Recce’d da sempre vi dice e vi scrive, tutto sta nel capirne qualche cosa, nell’essere consapevoli di ciò che accade intorno a voi e noi. Cosa che al giornalista, così come al venditore di Fondi Comuni chiamato private banker, sfugge del tutto. per lui, l’importante è la “notizia del giorno” e non certo la continuità o la coerenza delle scelte.
I soldi, mica sono i suoi: sono i vostri.
In Recce’d restiamo invece legati al concetto di “investimento uguale creazione di valore nel tempo”, e un processo di creazione di valore deve partire, necessariamente, dal capire dove sta il valore oggi. Cosa resa quasi impossibile dalle politiche dissennate dei banchieri centrali, come già detto: ma ripetiamo che quell’assetto di potere ed istituzionale sta per andare in rottami, e quindi per noi investitori è necessario prepararsi al nuovo.
Da questo punto di vista, sia la sfida Trump-Biden, sia l’epidemia di COVID-19 contano pochissimo.
Leggendo questo nostro Longform’d, ve ne rendete conto. In questo Longform’d, noi ci occuperemo in particolare di Borsa. Abbiamo scritto e parlato poco di Borse, negli ultimi sei mesi, perché (per ragioni che abbiamo ampiamente illustrato, anche nei precedenti due Longform’d) da tempo la Borsa non sta più al centro dei mercati finanziari internazionali.
La Borsa oggi è un “di cui”: non può o non potrà muoversi in modo autonomo: la Borsa oggi dipende da ciò che succede e succederà in altri comparti del mercato finanziario internazionale. La Borsa, in questo ultimo trimestre 2020, è davvero poco importante. Pochissimo.
Nonostante questo, non possiamo, in quanto gestori di portafoglio, abbassare la guardia e distrarre l’attenzione: abbiamo la necessità di capire ed essere consapevoli, sempre. Per questo abbiamo scelto nel terzo Longform’d di occuparci di Borsa.
La domanda che ci facciamo oggi è se, in questo panorama finanziario sconvolto ed inquinato, la Borsa è ancora un veicolo di investimento attraverso il quale è possibile creare valore per chi investe, oppure se si tratta soltanto di una discarica, del regno del trash.
Per questo, oggi regaleremo ai lettori del sito una serie di strumenti, di analisi e valutazione, lasciando poi a loro, ai lettori, di formare una propria opinione. Noi daremo le nostre indicazioni operative, sulla Borsa e sul resto, in esclusiva ai nostri Clienti.
Come vedrete, per profondità, ampiezza e senso critico, sono strumenti ed analisi che trovate soltanto qui. Solo Recce’d, grazie ai propri spazi di indipendenza uniti a standard di servizio superiori alla media, oggi vi può regalare contributi di questa qualità, tempestività e profondità.
Veniamo allora alla Borsa, e cominciamo con un articolo del Wall Street Journal, che fu pubblicato nel mese di agosto del 2018, ovvero quasi due anni prima del COVID. Un solido supporto alla convinzione, che noi abbiamo messo decine di volte in evidenza, che l’epidemia di COVID-19 ha soltanto fatto venire alla luce fragilità e debolezze che erano visibili già da numerosi anni..
(nota: come già scritto nel precedente Longform’d, l’articolo che segue viene lasciato in lingua inglese, il che potrebbe costituire una difficoltà; a fronte di questo, ognuno di voi lettori utilizza cento volte al giorno termini come lockdown, entrati anche nel vocabolario ufficiale: e pertanto, prevale la volontà di fare leggere in questo Blog cose che sono utili ed intelligenti, piuttosto che fare leggere sciocchezze soltanto perché scritte in lingua italiana)
By Mark Hulbert
Aug. 5, 2018 10:12 pm ET
The stock market’s return over the next decade is likely to be well below historical norms.
That is the unanimous conclusion of eight stock-market indicators with what I consider the most impressive track records over the past six decades. The only real difference between them is the extent of their bearishness. (See chart below.)
Of course, it is impossible to say that there aren’t other indicators with even better long-term records than these eight. But I’m not aware of any.
To illustrate the bearish story told by each of these indicators, consider the projected 10-year returns to which these indicators’ current levels translate. The most bearish projection of any of them was that the S&P 500 would produce a 10-year total return of 3.9 percentage points annualized below inflation. The most bullish was 3.6 points above inflation.
Even the bullish end of that range is more than 3 annualized percentage points below the stock market’s inflation-adjusted return over the past 200 years.
The most accurate of the indicators I studied was created by the anonymous author of the blog Philosophical Economics. It is now as bearish as it was right before the 2008 financial crisis, projecting an inflation-adjusted S&P 500 total return of just 0.8 percentage point above inflation. Ten-year Treasurys can promise you that return with far less risk.
Bubble flashbacks
The only other time it was more bearish (during the period since 1951 for which data are available) was at the top of the internet-stock bubble.
The blog’s indicator is based on the percentage of household financial assets—stocks, bonds and cash—that is allocated to stocks. This proportion tends to be highest at market tops and lowest at market bottoms.
According to data collected by Ned Davis Research from the Federal Reserve, this percentage currently looks to be at 56.3%, more than 10 percentage points higher than its historical average of 45.3%. At the top of the bull market in 2007, it stood at 56.8%.
Ned Davis, the eponymous founder of Ned Davis Research, calls the indicator’s record “remarkable.” I can confirm that its record is superior to seven other well-known valuation indicators analyzed by my firm, Hulbert Ratings.
Overvalued by Almost Any Measure: Ratio of S&P 500's current reading to average since 1954

To figure out how accurate an indicator has been, we calculated a statistic known as the R-squared, which ranges from 0% to 100% and measures the degree to which one data series explains or predicts another.
In this case, zero means that the indicator has no meaningful ability to predict the stock market’s returns after inflation over the next 10 years. On the other hand, a reading of 100% would mean that the indicator is a perfect predictor.
Since 1954, according to our analysis, the Philosophical Economics indicator had an R-squared of 61%. In the messy world of stock-market prognostication, that is statistically significant. Our analysis begins in that year because that is the earliest date for which data are available for all of the other indicators that we studied.
The other seven
So, here’s a look at those other indicators back to the 1950s, listed in descending order of their R-squareds:
• The Q ratio, with an R-squared of 46%. This ratio—which is calculated by dividing market value by the replacement cost of assets—was the outgrowth of research conducted by the late James Tobin, the 1981 Nobel laureate in economics.
• The price/sales ratio, with an R-squared of 44%, is calculated by dividing the S&P 500’s price by total per-share sales of its 500 component companies.
• The Buffett indicator was the next-highest, with an R-squared of 39%. This indicator, which is the ratio of the total value of equities in the U.S. to gross domestic product, is so named because Berkshire Hathaway Inc.’s Warren Buffett suggested in 2001 that is it “probably the best single measure of where valuations stand at any given moment.”
• CAPE, the cyclically adjusted price/earnings ratio, came next in the ranking, with an R-squared of 35%. This is also known as the Shiller P/E, after Robert Shiller, the Yale finance professor and 2012 Nobel laureate in economics, who made it famous in his 1990s book “Irrational Exuberance.”
The CAPE is similar to the traditional P/E except the denominator is based on 10-year average inflation-adjusted earnings instead of focusing on trailing one-year earnings.
• Dividend yield, the percentage that dividends represent of the S&P 500 index, sports an R-squared of 26%.
• Traditional price/earnings ratio has an R-squared of 24%.
• Price/book ratio—calculated by dividing the S&P 500’s price by total per-share book value of its 500 component companies—has an R-squared of 21%.
According to various tests of statistical significance, each of these indicators’ track records is significant at the 95% confidence level that statisticians often use when assessing whether a pattern is genuine.
However, the differences between the R-squareds of the top four or five indicators I studied probably aren’t statistically significant, I was told by Prof. Shiller. That means you’re overreaching if you argue that you should pay more attention to, say, the average household equity allocation than the price/sales ratio.
The bulls’ response
What do the bulls say about all this? To find out, I turned to Jeremy Siegel, a finance professor at the Wharton School of the University of Pennsylvania.
Prof. Siegel is perhaps best known as the author of “Stocks for the Long Run,” in which he argues that buying and holding equities for the long term is the best advice for most investors.
In an interview, Prof. Siegel questioned the strength of these indicators’ statistical foundation. He says their historical records contain peculiarities that traditional statistical tests don’t adequately correct for. Once corrected, Prof. Siegel suspects that their R-squareds would be significantly lower.
Prof. Siegel also questions whether these indicators are really as bearish as they seem. Among the theoretical objections he lodged against these indicators:
• Accounting-rule changes in the 1990s. After those changes, he says, readings from the traditional P/E and the Shiller P/E were higher than before, so their recent levels aren’t particularly comparable to those from previous decades.
• The Buffett indicator has lost any relevance it may have once had because of the increasing proportion of U.S. corporate sales coming from overseas. That dynamic also artificially inflates the indicator and makes it appear more bearish than it should be, Prof. Siegel says.
• The Q ratio provided insight at a time when our economy was dominated by capital-intensive manufacturing companies, but not when it is dominated by high-tech information-age firms.
“What is the replacement cost for a Google or a Facebook FB ?” Prof. Siegel asks rhetorically.
It can’t be determined, however, whether correcting for these issues would transform the message of any of these indicators from bearish to outright bullish. Prof. Shiller of Yale, for one, says he isn’t aware of any indicator that currently is forecasting above-average returns over the next decade and sports a statistically significant record back to at least the 1950s.
Regardless, it is important to emphasize that, no matter how impressive the statistics underlying the indicators may be, they don’t amount to a guarantee that the stock market will struggle over the next decade.
After all, as Prof. Siegel reminds us, most of these indicators have been bearish for years now, even as stocks have enjoyed one of the most powerful bull markets in history.
Furthermore, even if stocks turn out to be lower in a decade’s time, none of these indicators tells us anything about the path that the market takes along the way. It might immediately head south from here, or it could enter a blowoff phase of sharply higher prices before succumbing to a severe bear market.
A leaf in a hurricane
Calling short-term trends is difficult, if not impossible. For instance, when it comes to calling one-year returns, Prof. Shiller said in an interview that he doesn’t know of any valuation indicator with a record extending as far back as the 1950s whose predictive power is significantly better than zero.
Ben Inker, head of the asset-allocation team at GMO, draws an analogy to a leaf in a hurricane: “You have no idea where the leaf will be a minute or an hour from now. But eventually gravity will win out, and it will land on the ground.”
Il medesimo autore, Mark Hulbert, ha pubblicato la settimana scorsa sul medesimo giornale, il Wall Street Journal, un aggiornamento di quel lavoro: il principale motivo di interesse di questo aggiornamento è constatare quando è grande la “passione per il trash” che viene espressa dalla maggioranza degli investitori oggi.
Risulta infatti, dal lavoro di Hulbert, che nell’ottobre 2020 i parametri indicano una sopravvalutazione degli asset di Borsa che è ancora maggiore di quella del 2018.
E questo, con una economia in profonda recessione e prospettive economiche di breve, medio, e lungo termine che sono le peggiori del Secondo Dopoguerra.
The stock market is hugely overvalued when judged against almost any historical standard.
That’s the conclusion that jumps out from the accompanying table, which reports the latest readings from eight stock market valuation indicators that have stood the test of time. The table also compares each indicator’s latest readings with those from a month ago, from the beginning of the year and relative to the past 20, 50 and 70 years.
I will be updating this table each month in this column, using the same methodology to calculate the values so you can be assured that apples will be compared only with apples.
The eight indicators that will be featured are:
The S&P 500’s price-to-earnings ratio. I will calculate this ratio using earnings per share in the as-reported trailing four quarters. Though that overlooks analyst estimates of corporate earnings over the subsequent 12 months, it is only by focusing on trailing EPS that I create a like-for-like comparison with historical data. (Read this column for a further discussion of how there is little consistency on Wall Street in how P/E ratios are calculated.)
The Cyclically-Adjusted Price/Earnings Ratio (CAPE). This ratio, made famous by Yale University professor (and Nobel laureate) Robert Shiller, is similar to the traditional P/E except that the denominator of the ratio is average inflation-adjusted EPS over the trailing 10 years.
The Total Return CAPE. This is similar to the better-known version of the CAPE, except that dividends are taken into account in the calculation.
The S&P 500’s dividend yield. The value I report each month will be calculated based on S&P 500 dividends actually paid over the trailing 12 months, as a percentage of the latest value for the index itself.
The S&P 500’s price-to-sales ratio. The latest value of the S&P 500 index divided by trailing four quarter sales per share.
The S&P 500’s price/book ratio. The latest value of the S&P 500 index divided by the index’s most recently reported book value per share.
The Q-ratio. This indicator was introduced many decades ago by the late James Tobin, the 1981 Nobel laureate. The value I report each month will be calculated by dividing the total market cap of publicly traded U.S. companies by the replacement cost of corporate assets.
The market cap/GDP ratio (otherwise known as the Buffett Indicator). I will calculate each month’s reading by dividing the total market cap of all publicly traded companies by the latest government estimate of GDP. For example, the value for this indicator that I report in the table is based on the initial estimate of third-quarter GDP, which was just released on Oct. 29.
This table shows how valuation ratios have increased this year, along with their percentiles rankings for three time periods in the three right-most columns.


To illustrate what the data in the table signify, take the P/E ratio in the top row. Its latest value is down slightly over the past month (to 33.4 from 33.9 ), but markedly higher than at the beginning of the year. The right-most three rows report where the latest P/E reading stands as a percentile of the historical distribution since 2000, 1970 and 1950. Notice that the current P/E is at the 88th percentile of all readings over the past 20 years, the 95th percentile since 1970 and 96th percentile since 1950.
Note that these indicators are relevant to the stock market’s longer-term prospects; they tell us little about the market’s near-term prospects. My favorite analogy for making this point comes from Ben Inker, head of asset allocation at Boston-based GMO. Likening the market to a leaf in a hurricane, he says “you have no idea where the leaf will be a minute or an hour from now. But eventually gravity will win out, and it will land on the ground.”
I’d be happy to include in the table any shorter-term indicators that have exhibited a statistically significant ability over the decades to forecasting the market’s near-term direction. If you know of any, I will be happy to consider adding them. Please email me any suggestions at the email address below.
La tabella che trovate nel testo dell’articolo selezionato per voi vi potrà essere molto utile: mette in una prospettiva storica, anche di lungo termine, l’attuale momento della Borsa di New York, e di riflesso di ogni altra Borsa di New York (tutte seguono, minuto per minuto, gli alti e bassi di New York, e potete verificarlo voi stessi ogni giorno).
Notate in particolare i dati percentuali. Vanno letti come una risposta alla seguente domanda: “nel periodo di tempo indicato in cima alla colonna, in quante occasioni questo dato è risultato INFERIORE a quello di oggi?”. Come vedete, in molti casi la risposta è: “nel 100% dei casi”.
A che cosa ci servono questi numeri e queste analisi? Non saranno forse vecchi strumenti del passato, oggi inadatti a comprendere le dinamiche della Borsa e le sue rosee e lucenti prospettive?
Non servono, ovviamente, per fare trading sul titolo Tesla. Attività che serenamente lasciamo a quelli che amano l’azzardo. A quelli ricordiamo però che le percentuali di vincita, in Borsa, sono inferiori a quelle per le scommesse sui cavalli 8e lo abbiamo documentato in questo Blog).
E all’ippodromo si respira un’aria più salubre.
I dati di questi due articoli però servono, come scrivevamo sopra, per un lavoro di ricerca del valore che è il solo possibile rimedio ai momenti di isteria collettiva.
Noi investitori siamo costretti a misurarci, e ormai da vent’anni, con mercati finanziari la cui caratteristica principale è la volatilità: ciò che oggi vale 100 tra 30 giorni può valere 65, come è successo ad esempio nel marzo 2020 e come accadrà nuovamente.
Torniamo ora alla settimana appena conclusa. L’ultima settimana di ottobre, offre un eccellente esempio di ciò che stiamo affermando in questo Longform’d..
The Dow Jones Industrial Average pulled back 156 points, or 0.6%, on Friday to close out October with a 4.6% drop — the worst month for the Dow since March, when it plunged nearly 14%. The index has now fallen 7.1% for 2020. (All price changes in this article exclude dividends.)
• The S&P 500 Index was down 1.2% on Friday, ending October with a 2.8% decline. That followed a 3.9% decrease in September. The benchmark index is now up 1.2% for 2020.
• The Nasdaq Composite Index tumbled 2.4% on Friday, settling the month down 2.3%. The technology-heavy Nasdaq is up 21.6% this year.
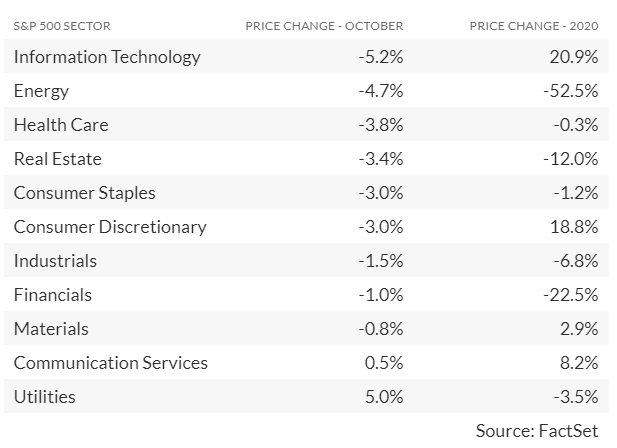
The information technology sector was the worst performer among the 11 sectors of the S&P 500 for the month
La tabella qui sopra offre un esempio concreto, del perché non si può fare a meno dei parametri e degli indicatori utilizzati nei due articoli che avete appena letto più sopra. Leggendo questi dati, che cosa è conveniente fare con i propri soldi?
Non potyete fare a meno dei dati letti nei due articoli, per rispondere. Oppure, forse voi volete investire sulla Borsa di New York andando dietro a quel tizio che vi propone di “investire in America”, come in quelle immagini degli Anni Trenta e Quaranta con il piroscafo?
Se invece siete persone non solo ragionevoli ma pure analitiche, che voglio comprendere ciò che si fa dei loro soldi, allora non c’è alternativa all’analisi ed al lavoro.
Un secondo esempio. Le variazioni di prezzo che leggete qui sotto nella tabella, che sono quelle dei titoli azionari compresi nell’indice Dow Jones Industrial di New York nel 2020, a voi che cosa dicono? E al vostro promotore finanziario, wealth manager, family banker e personal banker, che cosa vi suggeriscono di fare? Oppure lui vi ha detto che “è meglio lasciare perdere l’America, è troppo lontana e bisogna prendere l’aereo”?

Che cosa ne pensate, di questi numeri? Si tratta di fati poco importanti? Oppure molto significativi? Dovete mettere mano al portafoglio, per tempo, oppure come vi dice sempre il promotore finanziario “è meglio stare fermi, che poi tanto tutto sale sempre”?
Recce’d vi suggerisce di svegliarvi, darvi una mossa, e mettervi al lavoro, e proprio su questi dati, nell’interesse esclusivo dei vostri risparmi.
Si tratta di un lavoro indispensabile: e se voi investitori non disponete del tempo oppure dell’attenzione per farlo dovete esigerlo, da chi vi assiste nelle scelte di investimento, e non una volta ogni tre anni bensì una volta ogni quindici giorni. Se non è in grado di affrontare questi temi, con questa frequenza, allora dovete cambiare riferimento, perché il vostro attuale riferimento vi parla di cose che non conosce a sufficienza.
Abbiamo detto indispensabile: ma dobbiamo anche dire insufficiente. I parametri non bastano, per supportare le scelte di investimento. E’ da lì, che è necessario partire, ma non ci si può fermare lì.
Ci sono altri fattori, che è necessario seguire con un monitoraggio quotidiano, se davvero si intende investire in Borsa. Oggi però, al concetto di investire molti hanno sostituito il criterio della scommessa, come per il Gratta e Vinci. E questo è un dato che noi investitori non possiam trascurare.
Facciamo un passo indietro. In numerose occasioni, vi abbiamo scritto che il mercato finanziario è fatto di uomini e di istituzioni, ed ognuno di questi segue un proprio interesse personale, che è nella maggior parte diverso dal vostro interesse di investitori finali.
Recce’d da questo punto di vista è una sgargiante eccezione.
Gli uomini, le Istituzioni, le partiche commerciali e di vendita, influiscono sull’andamento dei prezzi. Questi uomini, queste Istituzioni, e queste pratiche commerciali cambiano nel tempo, e devono essere seguiti dall’investitore finale con attenzione.
Vi proponiamo in lettura un articolo del medesimo autore, che documenta il clima che si è instaurato in Borsa negli ultimi anni, clima in cui si associano “l’amore del trash” e “l’amore delle scommesse e dell’azzardo”. No avrebbe senso oggi neppure pensare di investire in Borsa, senza avere compreso a fondo questo cambiamento nei comportamento della massa degli investitori
Come dite? Gli altri vi ripetono sempre che “investire è facile” mentre noi la facciamo sembrare una cosa difficile, delicata, e che richiede attenzione e competenza? Ebbene, è vero: siamo colpevoli di questo peccato.
Opinion: People are spending over three times more money ‘gambling’ on hot stocks than at casinos and on lottery tickets and sports betting
Published: Oct. 31, 2020 at 9:32 a.m. ETBy
Mark Hulbert
Researchers studied ‘lottery’ stocks, which have low prices and high volatility

Like Claude Rains’ character in the classic film “Casablanca,” would you be shocked to discover that a lot of gambling goes on in the stock market?
Prepare to be shocked. According to just-completed research, gambling in the stock market is far more prevalent than previously imagined. The study’s authors — all finance academics — calculate that the dollar value of the gambling is at least three-and-one-half times the combined global total of activities at casinos, online gambling, gaming machines, bingo/keno, lotteries, horse tracks and sports betting.
So don’t judge those who frequent casinos, lotteries, horse tracks and the like. Your activities in the stock market aren’t necessarily different, even if “investing” carries with it more societal legitimacy than “gambling.”
The study, titled “Only Gamble in Town,” was conducted by Alok Kumar of the University of Miami, Huong Nguyen of the University of Da Nang in Vietnam, and Talis Putnins of the University of Technology in Sydney, Australia.
Since the distinction between gambling and investing is a function of investor intent, it’s impossible to directly measure how much gambling goes on in the stock market. The researchers get around this difficulty by focusing on the trading volume of a group of so-called lottery stocks that are most likely to interest gamblers. If no gambling were going on in the stock market, then the trading volume of these stocks (relative to past norms) would be no different, on average, than for non-lottery-type stocks.
That’s not what the researchers found. The researchers define these lottery stocks as those that have low prices, high volatility, and return distributions that are positively skewed. This last characteristic means that they have a small probability of a really big payoff.
Though many of these stocks are hardly household names, Kumar said that’s to be expected. Usually by the time a stock has become a household name it will have a much higher price and significantly lower volatility than the typical lottery stock. An example is Netflix , which in its early days as a public company did satisfy the researchers’ definition of a lottery stock. It does not today.
Note carefully that someone could own a lottery-type stock for reasons having nothing to do with gambling, just as it’s possible someone could be gambling with a non-lottery stock. But, assuming these two possibilities cancel each other out, the difference in the relative trading volumes of these two groups of stocks should be a good estimate of how much gambling occurs in the stock market.
Confirmation that the researchers are in fact measuring gambling activity in the stock market came when countries imposed restrictions on traditional gambling activities. In the wake of those restrictions, trading activity in lottery stocks jumped. Likewise, when those restrictions were relaxed, trading activity in lottery stocks often fell.
Investment implications
While this study’s findings have major cultural, social and psychological significance, I’m interested in its investment implications. Perhaps the most crucial is that lottery stocks may be overvalued. That’s because these stocks’ prices will have been bid up beyond where they would be trading if no gambling were to take place.
That doesn’t mean that no lottery stocks will richly reward those who purchase them. Some will, just as someone will win the state lottery. But that’s different than saying that these stocks, on average, are good long-term investments.
You might think that regulators should try to discourage gambling in the stock market. But the researchers distance themselves from this suggestion: They find that “stock market gambling increases the amount of information that is reflected in prices, increases measures of informational efficiency, and reduces measures of noise in prices… Therefore, even if gamblers are relatively or completely uninformed traders, they can still contribute to market efficiency by making markets more liquid and thereby encouraging informed trading.”
While the macro effects of gambling may be positive, that doesn’t mean you should engage in the activity yourself