
Longform'd. TINA se ne è andata e non ritorna più?

Il mercato azionario internazionale è destinato a rimbalzare da qui a fine maggio? Si chiuderà così una fase di ribasso? Si può chiamare “correzione” la fase di ribasso dei primi mesi del 2022?
Le risposte a queste domande, Recce’d le darà ai suoi Clienti attraverso i tanti canali di comunicazione attivi ogni giorno con loro.
Ma soprattutto le darà con le nostre prossime mosse sui portafogli modello.
In questo Post, tuttavia, intendiamo regalare ai lettori del Blog qualche utile, concreto e specifico elemento di conoscenza, allo scopo di aiutarli a formare, loro stessi, una propria opinione.
C’è poi un secondo scopo: difendersi e proteggere il patrimonio dai luoghi comuni, dalle frasi fatte, dalle favole che vengono ogni giorno appioppate ai poveri investitori italiani che si affidano alle Reti di vendita di Fondi Comuni ed alle banche.
Per rispondere alle domande che aprono questo nostro Longfrom’d, è utile guardare ai tanti temi che ogni giorno sono presenti sulle prime pagine dei quotidiani: dall’inflazione alla crescita, dai tassi di interesse agli utili aziendali. E’ sicuramente utile, ma non è sufficiente. Noi in Recce’d guardiamo anche ad altri temi, che in questo Post vi esponiamo.
Tutti noi investitori usciamo da una fase di mercato che non ha alcun precedente nella storia: una fase di mercato estrema ed eccessiva, nella quale hanno dominato l’irrazionalità ed anche la follia (2020-2021). I mercati nel 2022 hanno (prevedibilmente) cominciato a fare i conti con questa follia. facciamo bene ad aspettarci che, nella fase di discesa, i maggiori indici di mercato si comportino come si erano comportati nelle precedenti fasi di ribasso? Se la fase di rialzo è stata diversa da ogni altra, esagerata ed eccessiva, la cosa può riflettersi anche sulla fase di ribasso?
E quindi, ritorniamo alla domanda iniziale: stiamo davvero nel coso di una “correzione”? Oppure si tratta di qualche cosa di diverso? A voi lettori regaliamo, qui di seguito, in lettura un articolo del Wall Street Journal della scorsa settimana, nel quale si afferma che “il mercato è cambiato”. L’articolo spiega che non sono soltanto i prezzi, ad essere cambiati: sono cambiati gli operatori di mercato, la loro psicologia, i loro atteggiamenti.
L’articolo, che è della settimana scorsa, si riferisce in modo particolare all’esercito degli investitori fai-da-te, ovvero ai “retail”, ovvero agli investitori al dettaglio: quelli che, solo 12 mesi fa, si erano autoconvinti di essere in grado di “dominare il mercato” soltanto scrivendosi in chat con quattro amici, come spiega ancora oggi una pubblicità in TV (che promette di “trasportarvi sulla Luna”, e che vedete sotto nella nostra immagine).

Oggi per queste “sollecitazioni del pubblico risparmio” le Autorità nazionali ed internazionali non hanno previsto alcun tipo di sanzione o regolamentazione, e preferiscono investire il loro tempo e le loro risorse in altre attività. Ed è un problema, perché anche a causa di questo tipo di “manie collettive” sui mercati si propagano eccessi ed enormità come quelle che tutti hanno visto negli anni 2020 e 2021. Eccessi ed enormità da cui successivamente seguono i danni, non solo per chi ha messo in moto la cosa.
Torniamo quindi al tema del “rimbalzo” e al tema associato della “correzione”: per valutare se è arrivato quel momento in cui ci si deve “buttare a pesce”, oltre all’inflazione, oltre alla crescita, ed oltre agli utili aziendali, dovete necessariamente chiedervi se il mercato “è cambiato” anche in fase di discesa. Leggiamo che cosa ne scrive il Wall Street Journal la settimana scorsa.
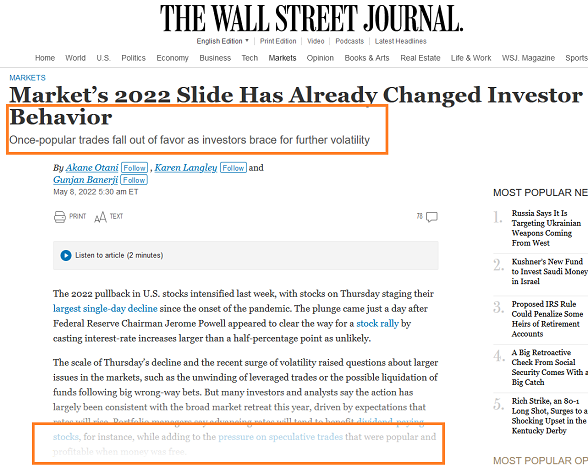
By Akane Otani , Karen Langley and Gunjan Banerji
May 8, 2022 5:30 am ET
The 2022 pullback in U.S. stocks intensified last week, with stocks on Thursday staging their largest single-day decline since the onset of the pandemic. The plunge came just a day after Federal Reserve Chairman Jerome Powell appeared to clear the way for a stock rally by casting interest-rate increases larger than a half-percentage point as unlikely.
The scale of Thursday’s decline and the recent surge of volatility raised questions about larger issues in the markets, such as the unwinding of leveraged trades or the possible liquidation of funds following big wrong-way bets. But many investors and analysts say the action has largely been consistent with the broad market retreat this year, driven by expectations that rates will rise. Portfolio managers say advancing rates will tend to benefit dividend-paying stocks, for instance, while adding to the pressure on speculative trades that were popular and profitable when money was free.
For stocks, that trend has meant pain for the shares of firms that ran up during the pandemic years and carry large valuations.Netflix Inc., one of the hottest tech stocks of recent years, is down 70% this year. Amazon.com Inc.is down 31%, lagging behind even the slumping major stock indexes. Below we consider a few signs of the unrest in markets when buying the dip no longer pays immediate, predictable benefits.
The breadth of the market’s selloff has been striking. Few stocks have been spared.
Just 35% of stocks in the S&P 500 were trading above their 200-day moving averages Thursday, according to FactSet. That was down from 74% in January. Within the Nasdaq Composite, just 20% of stocks traded above their 200-day moving averages that day, down from 38% in January.
“There’s a lot of weakness that’s taking place beneath the surface,” said Willie Delwiche, investment strategist at All Star Charts.
The rout has dragged stock-market valuations lower.
Even after recent drawdowns, though, the S&P 500 still looks expensive relative to its valuations over the past decade. The S&P 500 traded last week at 17.7 times its projected earnings over the next 12 months, according to FactSet, above its 10-year average of 17.1 times earnings. With the Fed poised to continue tightening monetary conditions, many investors say stocks still don’t look cheap.
As stocks have tumbled, investors have tempered their enthusiasm for risky bets in the options market.
For much of the past two years, individual investors had rushed to the options market to place ultrabullish bets on stocks. Options bets became synonymous with the frenzy surrounding meme stocks, as shares of companies such as GameStop Corp. and AMC Entertainment Holdings Inc. soared.
Now, much of that speculation appears to be winding down. Net call option volumes in single stocks recently hit the lowest level since April 2020, according to Deutsche Bank.
The price of bullish options on stocks has also started to come down relative to bearish options, according to Credit Suisse. That is a reversal from much of the past few years, when investors looking to amp up bets on particular stocks rising supercharged demand for bullish options.
Other risky markets have taken a hit. Bitcoin prices peaked this year in March and have generally fallen since then to trade around $36,000.
The cryptocurrency’s descent has likely had a bruising effect on not just individual investors, but also a growing crowd of institutional investors. While cryptocurrencies in their early days were primarily bought and sold by retail traders, hedge funds and registered investment advisers have become a bigger presence in the markets in recent years.
As the rout has left money managers with few places to hide, surveys have shown individual investors becoming increasingly pessimistic about the stock market.
The share of investors who believe the stock market will fall over the next six months ended April at its highest level since March 5, 2009, according to the American Association of Individual Investors.
Widespread pessimism isn’t necessarily bad news. Some analysts view the AAII survey as a contrarian indicator, betting that when sentiment appears to have soured to an extreme level, markets are poised for a rebound. (Back in 2009, the S&P 500 hit its financial-crisis closing low just four days after the AAII reading.)
“Sentiment data can do a good job of saying, if we’re not exactly at the market bottom, we’re probably in the ballpark,” said Ross Mayfield, investment strategy analyst at Baird. “So if you’re being very tactical, those are the good times to put money to work.”
One reason some investors are looking at markets with hesitation these days: inflation. After factoring in price increases, the S&P 500’s earnings yield has fallen dramatically. That has made it harder for investors to justify paying a premium to own stocks over other investments, Morgan Stanley Wealth Management said.
Some investors bracing for further turmoil are turning to inverse funds, which offer buyers the chance to bet on declines in stocks or indexes. By one measure, activity in such funds recently hit the highest level of the past decade, according to Jason Goepfert, founder of Sundial Capital Research.
“Retail investors are betting against stocks,” Mr. Goepfert said. “They’re hedging their portfolios”-
L’articolo del Wall Street Journal, come avete visto, non fornisce alcuna risposta definitiva: via aiuta però a capire, e a valutare, fornendo utili elementi di informazione.
Tra le cose che voi lettori siete chiamati a valutare, una è la seguente: per quale ragione, in TV al TG economia oppure sul vostro giornale preferito non leggete più quelle sigle che soltanto sei mesi fa andavano per la maggiore.
Elenchiamole:
BTD
FOMO
TINA
Per qualche tempo, hanno dominato sui media: tanto che è superfluo spiegarne di nuovo il significato.
Se in particolare ci occupiamo di TINA, la ragione per la quale oggi non leggiamo più di TINA nei titoli degli articoli di giornale è semplice: adesso, una alternativa alle azioni esiste, come ci racconta il grafico qui sotto.
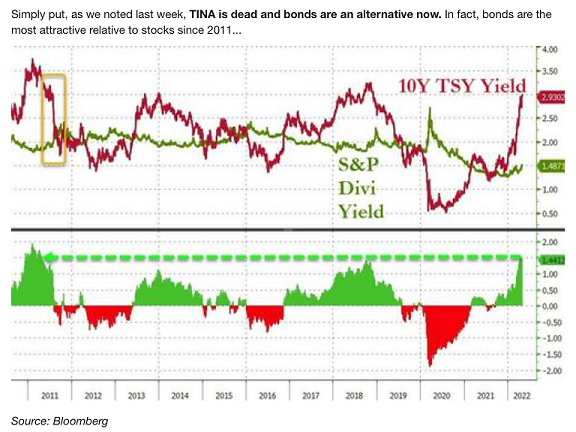
Il grafico qui sopra, ed il grafico qui sotto, ci servono per mettere in evidenza che l’aumento dei rendimenti delle obbligazioni oggi rende meno conveniente, rispetto al recente passato, l’investimento in azioni: almeno da questo punto di vista, ovvero se mettiamo a confronto il rendimento delle obbligazioni ed il rendimento delle azioni in termini di dividendi distribuiti.

Ovviamente, questo elemento di valutazione non è sufficiente, da solo, a spiegare i recenti cali degli indici azionari, né può da solo spiegare il cambiamento nell’atteggiamento e nella psicologia degli investitori retail che aveva messo in evidenza, poco più sopra, l’articolo del Wall Street Journal.
Secondo un certo numero di commentatori, come leggete nell’immagine sotto, quei soggetti che avevano alimentato la mania del 2020-2021 hanno semplicemente … mollato la presa, si sono arresi all’evidenza, ed hanno ridotto il loro entusiasmo, dopo avere aspettato per mesi un rimbalzo che non arriva..
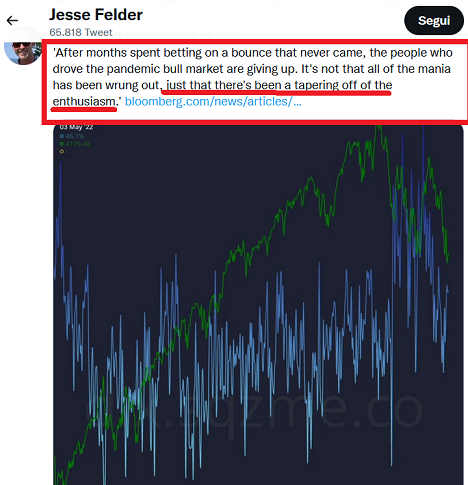
Ma questo è solo un “si dice”, è una cosa che circola tra gli operatori di mercato, è semplicemente uno dei tanti aneddoti a proposito del comportamento degli investitori.
Trattandosi di aneddoti, di cose raccontate e non di dati certi, sarà utile ricordare che soltanto qualche settimana fa, ovvero tra fine marzo ed inizio aprile, si registrò un rimbalzo molto ampio degli indici delle Borse, in coincidenza con la fine della prima fase della guerra in Ucraina.
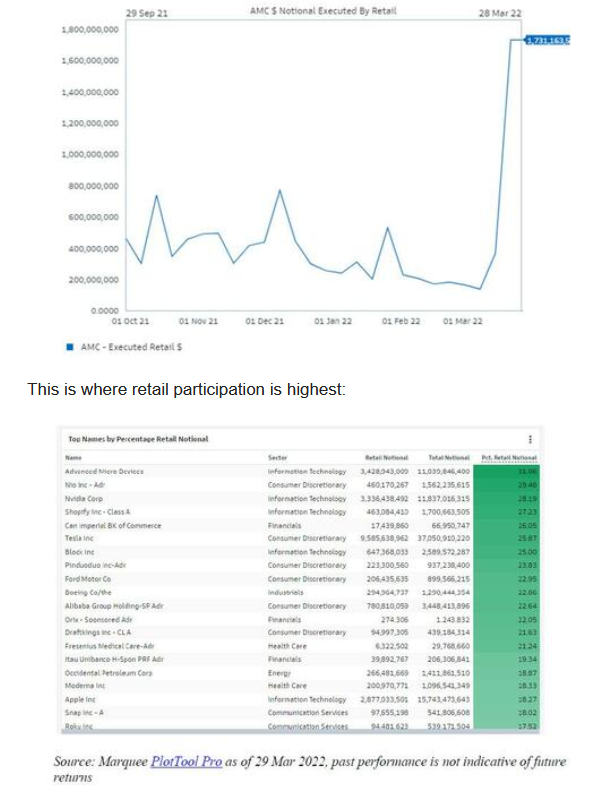
E proprio in quel periodo si parlava ancora di BTD, di “buy-the-dip”, ovvero di “compera il ribasso” (della Borsa) come atteggiamento prevalente tra i piccoli investitori al dettaglio. Lo leggete qui sotto nell’immagine, che (ripetiamo) è solo di qualche settimana fa.

Su questo argomento, noi riteniamo che vi sarà utile rileggere un commento che fu scritto allora, quando sui mercati di Borsa si registrò quel rimbalzo di fine marzo: abbiamo selezionato per voi lettori l’articolo che segue, articolo che allora (ripetiamo, a fine marzo: ma è utile leggerlo oggi) ci spiegava “le ragioni del rimbalzo”.
L’articolo è molto significativo, perché ci riporta le osservazioni di chi, dall’interno di Goldman Sachs, osserva in modo diretto i flussi di acquisto, ed i flussi di vendita: da dove vengono i soldi, e dove se ne vanno i soldi.
Goldman Sachs solo un mese e dieci giorni fa osservava (come potete leggere) che nelle chat tra investitori retail in quel momento ai temi macroeconomici come inflazione e i tassi di interesse non era attribuita grande rilevanza, mettendo in evidenza che gli investitori individuali negli Stati Uniti sono ancora la categoria che detiene in portafoglio la quota più importante del totale delle azioni in circolazione, e che (secondo Goldman Sachs) sono pronti a ritornare “investitori aggressivi” come prima.
Ne usciva, da questa analisi fatta un mese fa, che l’investimento in azioni avrebbe goduto in quel momento di prospettive favorevoli.
Over the weekend, when looking at the latest JPMorgan Prime Brokerage data, we noted that the "pain trade" remains higher as unlike retail, hedge funds have been selling every rally aggressively with the largest US bank seeing "net selling in 8 of the past 9 days," during which stocks have staged a torrid rally.
At the same time, we also observed that the bulk of the recent market meltup has been on the back of a massive short squeeze and covering of puts (creating a delta and gamma squeeze) which makes it especially difficult to predict what happens next as most if not all of the recent market meltup has been due to technicals and positioning, not fundamentals.
Still, one can conclude that either hedge funds will reverse their selling soon and jump on board the retail buying bandwagon (at which point it will again be time to short), or retail will run out of buying power amid the hedge fund-to-retail "distribution", and stocks will tumble once again.
The outcome of that tensions is, according to Goldman's flow trader Scott Rubner, the $64 trillion question: as he writes in his latest Tactical Flow of Funds note - in which he says that the top institutional investor question has been "who is buying the market +500 points in the last two weeks?" - do retail traders force institutional investors to re-leverage back into the equity market above (the prior ceiling of $4600).
Here are Rubner's 5 main (bullish, of course) observations:
The S&P 500 has closed up more than >1% in 6 out of the last 8 trading days. In the last 80 years, that’s only happened 2 other times.
US bonds are down -6.3% so far this year, on pace for their worst year on record (record is - 2.9% in 1994).
If the month closed today, US bonds would have the worst monthly performance in 42 years.
"I expect a MASSIVE rotation into equities in Q2. When do we start talking about new all-time highs for US Equities? Great Rotation / Great Migration type of stuff."
Global PWM’s are making the calls today for next week. “hey, so we have these bonds, and we are sitting on cash”..... but inflation, yadda yadda yadda. new Q = new inflows.

Going back to the divergence between retail and institutional investors, here is why Rubner is "tracking the message boards again":
US Households own 39% of the $80 Trillion US Equity Market. ($31 Trillion)
Hedge Funds own 2% of the US Equity Market. Households own 20x more market cap than Hedge Funds (ZH: this, however, is a grossly inaccurate at best, since household ownership is a plug in the Fed's Flow of Funds report, and if anything, represents how little the Fed actually knows where the money ends up).
Goldman's analysis shows that the largest owner of the equity market, has scope to become the largest trader of the equity market yet again.
This is the biggest swing factor in the market today, and also the largest source of aggressive trading demand (at a time when liquidity and value traded has decreased).
You have to remember, despite the bearish macro backdrop and investor sentiment, this is not true for message board traders. Open the apps’s today to get the vibe.
Rubner then takes a look at the bigger tactical flow of funds checklist, and gives the lists the following 12 reasons why the S&P rallied ~500 handles in 11 trading days, and why he expects it will keep rallying?
April is a strong seasonal month. Over the last decade the average return for April is 2.34%, the second best month after November.
Great Rotation - Investors are reducing money in bonds, 11 straight weeks of outflows, and huge redemptions from cash funds losing to inflation by -7%. Households have $15 Trillion in cash holding.
Retail is back. Retail participation has dramatically increased and retail are buying weekly calls again. (+50% moves in GME, and huge gains in core retail favorites, TSLA/NVDA). Watch TSLA stock split news. They have fully paid their April 18th tax bill.
Great Repatriation Migration “I’m coming home”. This was the largest monthly move back into the USA on record (out of rest of world). Lot of $ is parked in low quality overseas. Foreigners also coming back to the US.
Systematic. We have +$46B worth of equities to buy from CTAs. This will take us through the end of the quarter.
Corporates are still the largest buyer in market, in a modest blackout window. Net demand (buybacks ex-issuance) is expected to be a record $700 Billion.
$3.5 Trillion worth of option notional rolled off two weeks ago. Gamma is short. The street is very short gamma around ATM strike.
PWM Model portfolios are aggressively selling bonds / credit, and moving back into US quality / tech / dividends.
Our PB team, showed a further capitulation of gross and net HF exposure.
HF’s generally are under exposed to a rally, and want not lag indices before statements go out on quarter-end.
Sentiment remains below COVID, March 2020 lows. (-1.8%)
Liquidity remains challenged. You can trade $5M on the screens of ESA (E-mini futures), this ranks in the 4th percentile in the last decade. This has had the most impact on the shorts trying to cover.
Goldman's bottom line: "flow of funds are still positive for the next two weeks, and there is a lack of supply."
La lettura dell’articolo per voi è interessante, perché vi chiarisce in che modo ragiona ed in che modo “legge i dati dei mercati” chi lavora sui mercati stessi in una posizione che è analoga al grossista che lavora ai Mercati Generali per l’ortofrutta: non decide, ma osserva chi compera e chi vende e in quale quantità.
Le cose poi, per la Borsa USA e per le altre Borse del Mondo, non sono andate nel modo previsto da Goldman Sachs nell’articolo appena letto, e questo per voi è utile perché vi conferma che non è sufficiente guardare ai flussi di ieri per immaginare i flussi di domani.
Ad esempio: leggete l’intervista che segue, in cui ci parla il creatore di una APP per il trading-on-line che fa concorrenza a Robinhood: questo inventore di APP ripete la ben nota storiella che “i giovano hanno molta fiducia in sé stessi e nelle loro risorse, voglio investire su sé stessi e quindi in azioni, e guardano al futuro con fiducia e quindi sono sempre bullish”.
Ammettiamo per un attimo (ma solo per un attimo) che queste frasi abbiano un senso compiuto, ma leggiamo anche il resto: ovvero che “i giovano stanno facendo la punta alle loro matite per capire che cosa fare durante una fase di ribasso”.
Ci pare interessante che questo imprenditore di APP dica queste cose, ovvero che i suoi clienti
stanno cercando di capire che cosa sia una fase di ribasso; e che
non abbiano ancora deciso che cosa fare in una fase di ribasso.
Tra i possibili sviluppi, c’è anche la possibilità che … tutti diventino meno “bullish”?
Vi lasciamo alla lettura dell’intervista e riprendiamo più sotto.
Our call of the day, from the founder and chief executive officer of competitive stock trading app Zingeroo, says institutional traders would be wise to keep paying attention to an increasingly sophisticated retail investor.
Prepandemic, notes Zingeroo’s chief Zoë Barry, the retail crowd represented 10% of the volume that was traded and didn’t share trading ideas — often seen in the Gen. X and older crowd. That figure then hit a high of 25%, and with it came much chattier investors.
“[Wall Street] completely underestimated what it would be like if 25% of the volume turned in a certain direction and turned away from institutional,” Barry told MarketWatch in a recent interview.
“…Gen. Z has actually started sharpening their pencils and doing the research as to what to do in a bear market.”
— Zoë Barry, CEO of Zingeroo
“And now Wall Street is all over sentiment data and they’re looking at what people are seeing, but they also want the core trading numbers because there’s a gap between what people chatter about and say online, versus what they actually trade,” she said.
As a former analyst at Dawson Capital, Barry said she wants to know what traders are saying versus what they’re trading, and why there are inflows on certain stocks. “If I were an institutional, I would be very, very wary of shorting a stock that has the potential to be a heartthrob of retail investors,” she said.
Barry’s app, which launched last autumn, is a rival to Robinhood, but features “bullpens” — chat groups to discuss investing topics — and “zones,” where performances can be benchmarked against others, while trades can be verified by “trading cards.”
The serial entrepreneur said 80% of Zingeroo’s users are millennials and Gen. Z, with the rest Gen. X plus. The younger crowd, she said, views trading activity as their so-called “M.B.A.” — investing in themselves and their own financial diversity.
“I think young retail investors are beginning to have a longer-term outlook than just you know, what is happening this week in the markets. I think that’s an overall positive for them,” she said. “They’re investing in the stock market and they’re investing in themselves and increasing their financial literacy and that’s positive.”
And in the first part of the quarter, there was lots of chatter about young investors being lost in the wilderness of a bear market. “And what we saw was Gen. Z has actually started sharpening their pencils and doing the research as to what to do in a bear market,” said Barry.
As for differences between generations, she said the Gen. X plus category will auto liquidate via stop losses, millennials tend to buy the dip, while Gen. Z is even more sophisticated. For example, she noted recent action on the SQQQ, a three-times leveraged inverse exchange-traded fund that tracks the Nasdaq-100, and called that “definitely unusual behavior for a retail investor.
“They basically said we’re not sure which of the growth stocks are going to be impacted most, so I’m not smart enough as a retail investor to pick exactly what stock will pull back,” said Barry. They are also not worried about catching the exact bottom of a market, but instead are looking at stocks they think will have a greater chance of being a future fundamental success.”
And this crowd “understands the future tools that are happening right now,” and are overall more bullish on themselves, their future potential and the economy overall, despite the geopolitical meltdown and rising inflation, said Barry.
La lettura che avete appena fatto è molto interessante, perché oggi sui mercati giocano un ruolo importante (più importante che in passato) anche questo tipo di intermediari e per conseguenza anche questo tipo di investitori.
Al punto di vista che avete appena letto noi vi suggeriamo di contrapporre quelli che leggerete nell’articolo che segue.
In questo articolo di Bloomberg, datato 9 marzo 2022 (due mesi fa), Mohamed El Erian anticipava che “il buy-the-dip” non costituisce più un guadagno assicurato per gli investitori, dopo essere stato l’atteggiamento dominante per quasi due anni.
Per il momento, quello che El erian aveva previsto si è verificato. Ma domani, che cosa succederà?
Ritornando alle nostre domande di apertura, potrebbe essere proprio questo l’elemento-chiave per rispondere alla domanda sul “rimbalzo” e sulla “correzione”: tutti noi lettori oggi siamo chiamati a rispondere alla domanda del titolo, de “TINA se ne è andata e non ritorna più”, come accadeva in quella nota canzone della musica leggera italiana, cantata dalla presentatrice dell’Eurovision Contest in questi giorni in TV.
Ci auguriamo di avere aiutato, come sempre in modo puntuale, qualificato e articolato, tutti i nostri lettori chiamati a decidere dei loro soldi in questo complicato momento di mercato.

By
9 marzo 2022, 11:30 CET
Mohamed A. El-Erian is a Bloomberg Opinion columnist. He is president of Queens’ College, Cambridge; chief economic adviser at Allianz SE, the parent company of Pimco where he served as CEO and co-CIO; and chair of Gramercy Fund Management. His books include "The Only Game in Town" and "When Markets Collide." @elerianm
Whether it was friends or total strangers, everyone seemed to have the same question for me on a recent trip. Is it time to buy the dip in stocks? After all, U.S. stock markets have already had a few encouraging bounces in the past two weeks of trading, though they proved both temporary and more than fully reversible.
Few have liked my answer because it contends that economics, finance and related policies have been relegated to the back seat when it comes to the drivers of price action. At this stage, their market question is closely related to a political and national security calculation associated with Russia’s invasion of Ukraine: Is there an offramp for Vladimir Putin anytime soon? If there is, the occasional bounce could translate into a sustainable longer-term rally. Absent that, more unsettling financial market volatility is in the cards.
The war aggravated what was already an unpleasant start to 2022 for stock investors. The top U.S. stock indexes are now down 10% to 18% this year, while widely followed indexes for Europe and emerging markets have fallen 15% and 12%, respectively.
Until recently, BTD was a profitable strategy — so much so that the investor conditioning that came with it made the dips less pronounced and shorter, especially as “fear of missing out” and “there is no alternative” to stocks joined the fray. What made BTD particularly successful is that markets were consistently supported by huge and predictable injections of liquidity from central banks as well as interest rates pinned near zero.
Data suggest that, during the first week of the war, retail investors were inclined to maintain this approach. But their purchases collided with sales from institutional investors, rendering the strategy less effective in maintaining and building on a short-term bounce. Behind this apparent change is a weakening of the central bank shield that, for too many years, decoupled ever-higher asset prices from fundamentals.
With raging inflation threatening to worsen in the next few months, the Federal Reserve has little choice but to ease its foot off the stimulus accelerator — a necessity that is amplified by the extent to which the central bank’s prolonged mischaracterization of inflation as transitory has damaged its credibility and caused it to lose control of its policy narrative. With that, markets are now a lot more exposed to the four-level economic impact of the war: direct repercussions on Russia and Ukraine, spillbacks to advanced countries, spillovers to developing countries, and changes in the functioning of the multilateral system.
The longer the war continues, the greater the magnitude of these four effects and the larger the scope for their adverse interactions. With that comes a simple but critical question: Can Putin find his way out anytime soon?
Without an orderly end to the war, the disruptions to commodity markets and supply chains will intensify, as will “self-sanctioning” by the corporate world; Europe will be pushed into an inflationary recession; China and the U.S. economies will slow notably; some commodity-importing developing countries will risk foreign-exchange and debt crises; and the new stagflationary baseline for the global economy as a whole will be associated with a growing risk of an outright global recession.
Neither economic and financial policies nor markets are well positioned to deal with this combination, let alone overcome it.
Traditionally, stagflation has been one of the hardest challenges for policy making. It is compounded because the war in Ukraine came when the Fed had already fallen behind inflation realities and failed to build the much-needed flexibility for its policy responses.
Meanwhile, energy policy is stymied by the extent to which the world has been losing the fight against climate change. Fiscal and debt balances have yet to reset after their aggressive deployment to fight Covid-19. And financial supervision and regulation are lagging behind the significant morphing and migration of risk from banks to nonbanks.
Markets have similarly been caught offsides. And it’s not just positioning. Already, market liquidity has proved patchy at times, including for U.S. Treasuries and, of course, individual stocks and commodities. In what fortunately remains a rarity for now, market malfunction has also reared its ugly head: Witness the London Metal Exchange’s suspension of chaotic nickel trading this week.
Without a halt to the atrocities against Ukraine and its people, the global economy and financial markets will face more disruption.
This is not a comforting context for the continued success of BTD. Unless investors can identify the so-far elusive Putin offramp, their heavily exposed equity positions would be better served by rationalizing them during the bounces rather than buying the current dip outright and hoping for the immediate initiation of a long rally. They should use this opportunity to focus more on selecting individual stocks while positioning for a future of greater dispersion in global economic performance.